Intel’s Tiger Lake 11th Gen Core i7-1185G7 Review and Deep Dive: Baskin’ for the Exotic
by Dr. Ian Cutress & Andrei Frumusanu on September 17, 2020 9:35 AM EST- Posted in
- CPUs
- Intel
- 10nm
- Tiger Lake
- Xe-LP
- Willow Cove
- SuperFin
- 11th Gen
- i7-1185G7
- Tiger King
Section by Andrei Frumusanu
Cache Architecture: The Effect of Increasing L2 and L3
Although the Willow Cove core doesn’t bring all that many improvements on the actual core microarchitecture, one big update for the design is the new memory subsystem thanks to a quite significant change in the caches of the design.
Intel here has made some big changes in the L2 caches as well as the L3 cache slices: they’ve both grown considerably bigger and have had their cache line exclusivity altered.
| Core Cache Comparison | ||||||
| Willow Cove |
AnandTech | Sunny Cove |
Cannon Lake |
Skylake | AMD Zen 2 |
|
| 48 KB 12-way |
L1-D | 48 KB 12-way |
32 KB 8-way |
32 KB 8-way |
32 KB 8-way |
|
| 32 KB 8-way |
L1-I | 32 KB 8-way |
32 KB 8-way |
32 KB 8-way |
32 KB 8-way |
|
| 1280 KB 20-way |
L2 | 512 KB 8-way |
256 KB 4-way |
256 KB 4-way |
512 KB 8-way |
|
| 3 MB (<=12MB) 12-way |
L3/core (Max. Total) |
2 MB (<=8MB) 16-way |
2 MB (<=8MB) 16-way |
2 MB (<=20MB) 16-way |
4 MB (<=16MB) 16-way |
|
| 2304 | uOp Cache | 2304 | 1536 | 1536 | 4096 | |
The L1-D and L1-I caches on Willow Cove remain the same as the predecessor Sunny Cove design, which means they retain their 48KB 12-way associative designs for the data cache, respectively 32KB 8-way associative design for the instruction cache.
Where things differ significantly is in the L2. This time around Intel has completely redesigned this part of the core and has increased the capacity by 150% by increasing it from 512KB to 1280KB. Furthermore, the actual usable capacity has increased even more between generations as the new design now moves from being inclusive of the L1 caches, to a non-inclusive design.
Compromises that had been made when increasing the cache by this great of an amount is in the associativity, which now increases from 8-way to a 20-way, which likely decreases conflict misses for the structure.
On the L3 side, there’s also been a change in the microarchitecture as the cache slice size per core now increases from 2MB to 3MB, totalling to 12MB for a 4-core Tiger Lake design. Here Intel actually reduced the associativity from 16-way to 12-way, likely increasing cache line conflict misses and decreasing access parallelism.
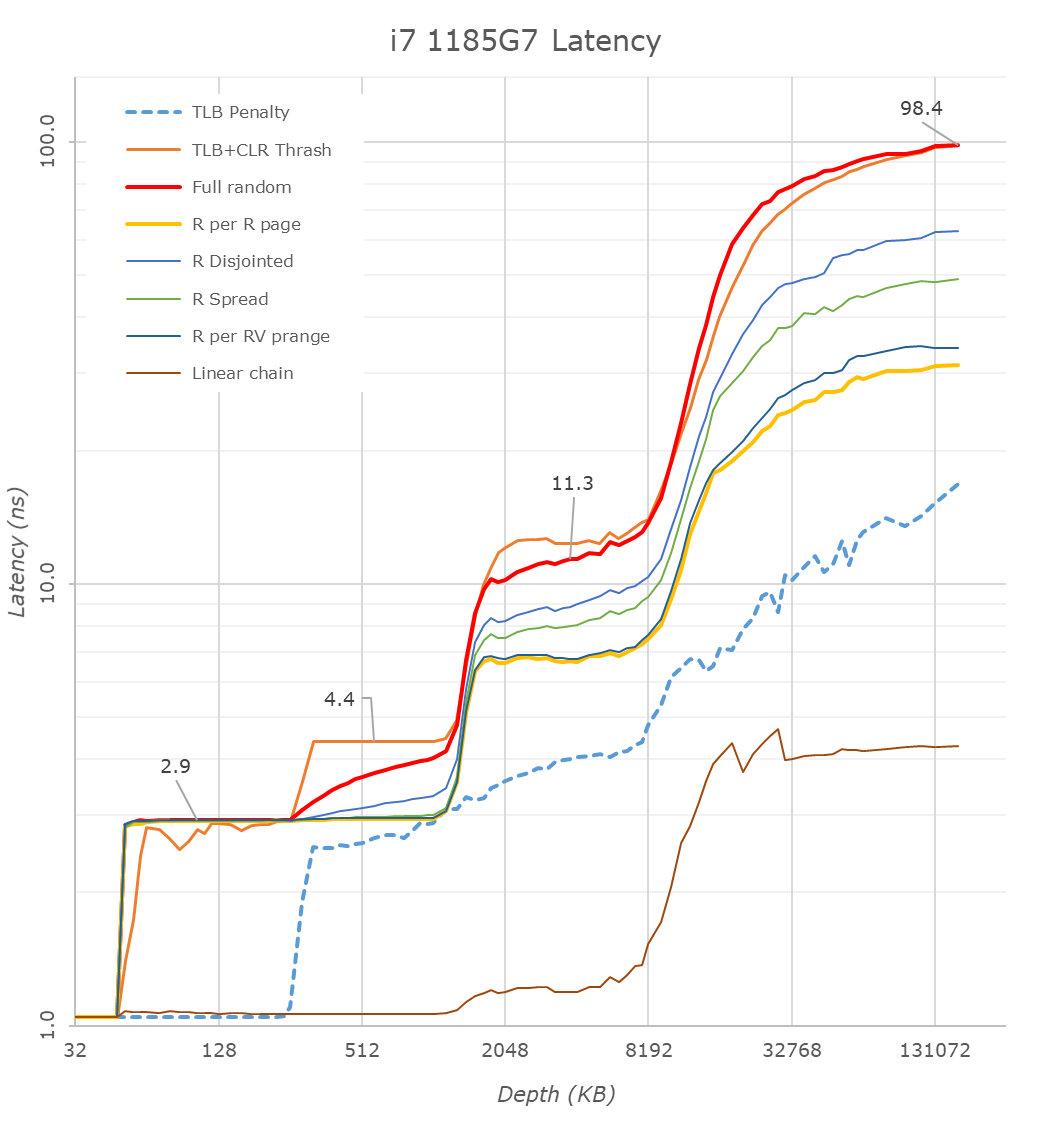
When looking at the i7-1185G7 in our custom latency test tool, we immediately note the cache structure changes when comparing the results to a previous generation design such as the Ice Lake based i7-1065G7.
First thing to note here about the results is the frequency of the cores as well as the system’s DRAM configurations: The Tiger Lake part clocked up to 4800MHz and featured LPDDR4X-4266 with 36-39-39 timings, while the Ice Lake figures were measured on a Surface Laptop 3, clocking at 3900MHz and LPDDR4X-3733 32-34-34.
On the L1 side of things as expected we don’t see much changes in latency beyond the clock frequency increase which brings access times down from 1.3ns to 1.04ns.
Moving onto the L2 cache is where things become interesting. Absolute access time figures go down from 3.3 to 2.9ns, but the Willow Cove core now extends this access time across a deeper depth up to 1.25MB – exactly as we’d expect given the cache’s larger structure this generation.
The access latencies don’t extend exactly to 12MB because starting from 8MB we’re exceeding the coverage of the L2 TLB at which point the core has to page-walk, incurring heavier latency penalties.
Intel hasn’t changed the TLBs this generation, still maintaining a 64-page L1 TLB which means that starting from 256KB depth (at 4KB pages), we’re seeing an increase in access times for access patterns which miss the first level TLB.
On the L3 we’re getting some interesting results which are both positive and negative. The positive thing of course is the vastly increased depth of the cache which now sees extended good access latencies up around the 10-12MB mark. What’s seemingly not so great is the fact that the absolute latency figures here aren’t really any different to Ice Lake, ending up nearly identical even though the Tiger Lake design clocks up to 23% higher in frequency. This is a sign that the cycle-access latencies of the design have gone up quite a bit this generation.
On deeper depths reaching DRAM, things are massively improved for the new Tiger Lake design: Full random access at an equal 160MB depth here in the graphs improve from 130ns to 98ns. Admittedly, we’re using different DRAM configurations between the two test platforms and the Tiger Lake system is using 14% higher clocked memory, but it does have worse timings. The actual latency improvements are well beyond the theoretical DRAM access latency difference, so what I think is happening here is that Intel has made some improvements to their memory subsystem and memory controllers.
We’re seeing a slight change in the access pattern latencies compared to Ice Lake, especially in the “R per R page” pattern which remains within a single memory page before moving onto the next, with the access latencies being 30% better than on Ice Lake. This does point out to some actual structural changes on the memory controller side, as otherwise the prefetcher behaviour at least doesn’t see any changes at all- with things being pretty much similar to back to what we’ve seen on Skylake.
What’s also interesting for the new design is that straightforward linear streaming patterns have seen a slight degradation, increasing from 3.516ns to 4.277ns on the new core. This is likely a side-effect of the added cache cycles in the lower level caches of the new Willow Cove core.
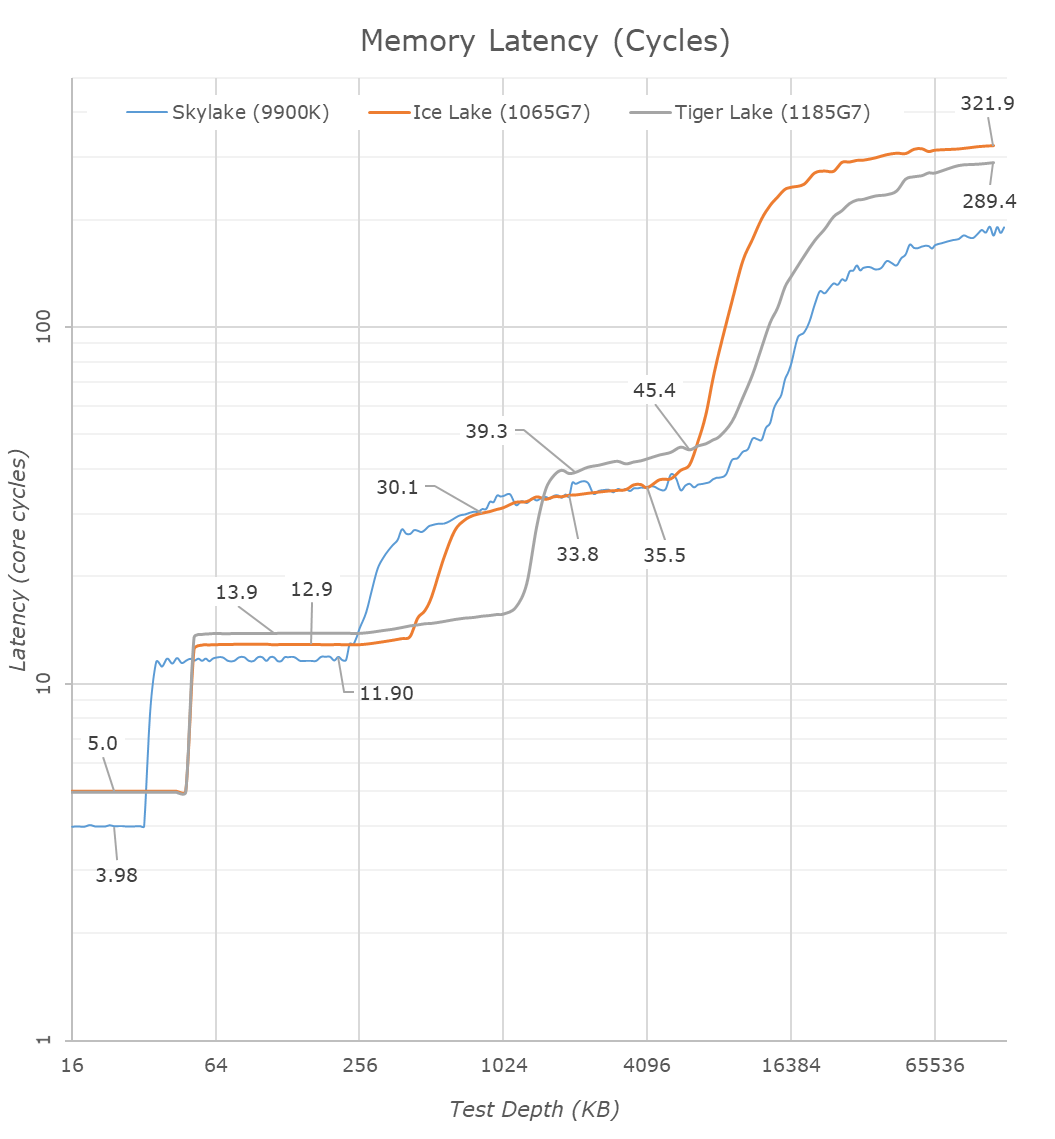
Translating the latency graph from nanoseconds to core cycles, we’re seeing the generational structural changes between the Sunny Cove and Willow Cove designs.
| Core Cache Latency (in core cycles) | ||||||
| Willow Cove | AnandTech | Sunny Cove | Cannon Lake |
Skylake | AMD Zen 2 |
|
| 5 | L1 | 5 | 4 | 4 | 4 | |
| 14 | L2 | 13 | 12 | ~12 | 12 | |
| 39-45 | L3 | 30-36 | 26-37 | 34 | ||
The L1D cache remains the same at 5 cycles latency, which is still a 1-cycle degradation over Skylake cores.
The L2 seemingly has gone up from 13 cycles to 14 cycles in Willow Cove, which isn’t all that bad considering it is now 2.5x larger, and its associativity has gone up. It’s interesting to contrast this against other similarly sized caches in the industry: Arm’s Neoverse N1 core has a 1MB cache coming in at 11-cycle latency, whilst their new X1 core shaves this down to 10 cycles. Of course, Intel’s designs clocks much higher, but the competitor’s design still would end up with better absolute access times.
The L3 cache cycle latency is a bit disappointing as we’re seeing essentially a +9 cycle degradation over the older design. This explains the previous access latencies which essentially just remained the same even though the core clocks in 23% higher.
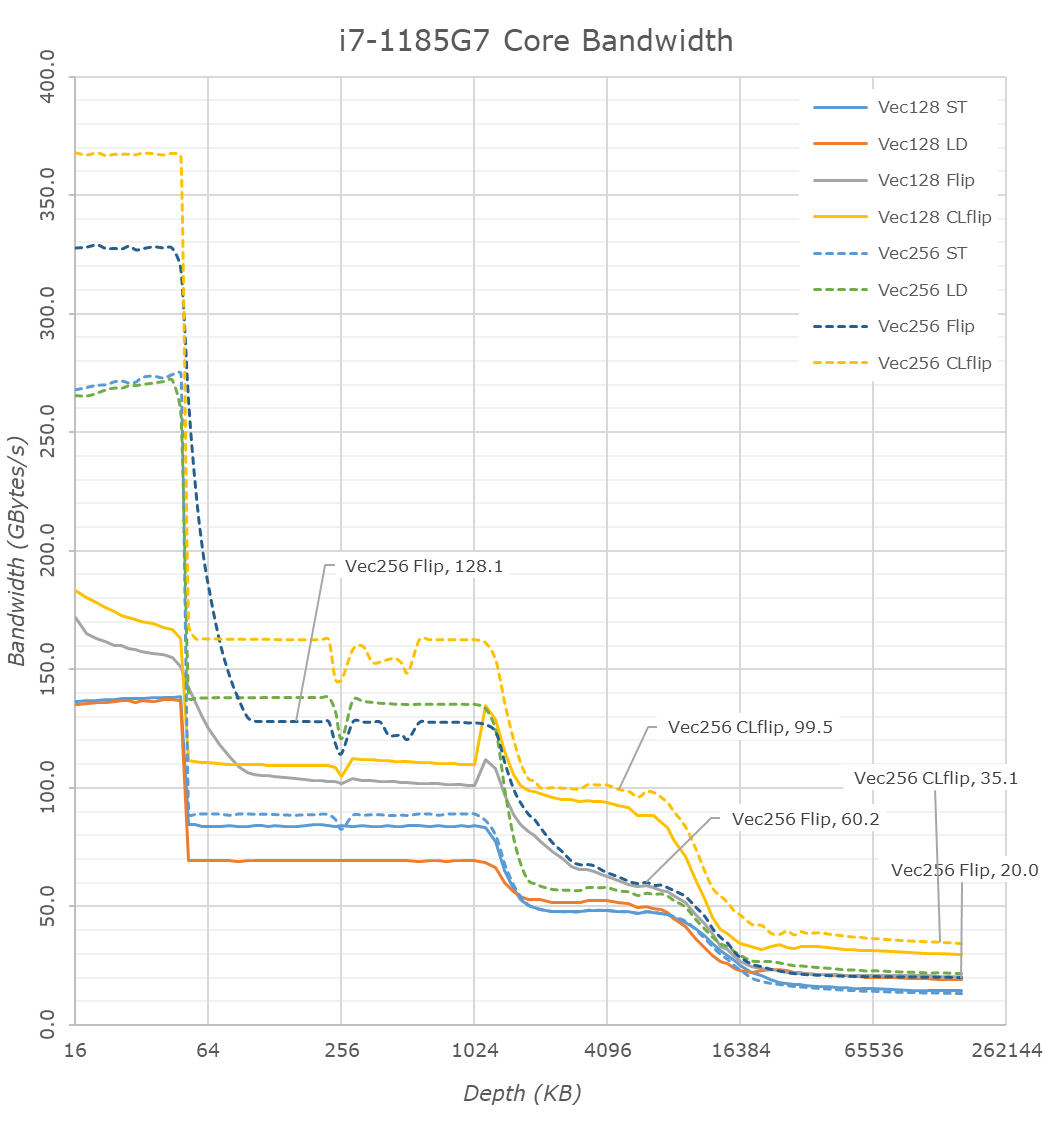
Finally, having a quick glance at the single-core bandwidth figures we’re looking if there’s been any significant structural changes in this aspect of the design.
On the L1 side of things, things are a bit odd as the figures don’t scale up as expected with the clock frequency, pure load and store bandwidth are indeed higher but the memory copy patterns are less than expected. In the L2 and L3 regions we can clearly see the increased depth of the caches. The L2 scales well with a near 19% increase in bandwidth which is in line with the clock uptick.
The L3 doesn’t scale that well as memory copies between cache lines here are only 5% faster than on Ice Lake, likely due to the increased access latencies of the caches.
In the DRAM region we’re actually seeing a large change in behaviour of the new microarchitecture, with vastly improved load bandwidth from a single core, increasing from 14.8GB/S to 21GB/s. Pure store bandwidth slightly goes down from 14.8GB/s to 13.5GB/s but that’s not quite important as a metric for x86 as the core first has to read out the memory before writing to it, as opposed to some of the non-temporal write optimisations we’ve seen from Arm processors.
More importantly, memory copies between cache lines and memory read-writes within a cache line have respectively improved from 14.8GB/s and 28GB/s to 20GB/s and 34.5GB/s. That’s a 35% improvement in copy bandwidth which is quite significant.
Overall, the new Willow Cove cores and the Tiger Lake memory subsystem seems sort of a mixed bag. The increased cache sizes are certainly welcome for workloads that have a larger memory-footprint; however, Intel’s L3 cache changes seem to have come with some larger compromises when it comes to latency. On the positive side, DRAM access latencies and bandwidth seem to have been drastically improved in the new design, and here it seems Intel made some good improvements in the fabric as well as the memory controllers of Tiger Lake.


253 Comments
View All Comments
huangcjz - Thursday, September 17, 2020 - link
No, you can say "have to hand" as in something which is available. E.g. "Do you have the presentation to hand?"29a - Thursday, September 17, 2020 - link
Wouldn't a non Iris chip be a fairer comparison to Renoir?Kamen Rider Blade - Thursday, September 17, 2020 - link
AMD's 4800U has a 25 watt mode, Hardware UnBoxed tested it against Intel.Why didn't you test it and put those results in the chart?
Why this biased reviewing of one side gets 15 watt and 28 watt scores.
Yet AMD isn't allowed to show 25 watt scores?
What are you afraid of when comparing like for like?
IanCutress - Thursday, September 17, 2020 - link
For us, the 15W to 15W results were the focal point. 28W is there to show a max Intel and look at scaling. Also, The amount of 4800U devices at 25W is minimal.Not only that, I'm on holiday. I had to spend two days out, while in this lovely cottage in the countryside, to write 18k words, rather than spend time with my family. I had 4 days with the TGL laptop, and 8 days notice in advance to prepare before the deadline. Just me with a couple of pages from Andrei, no-one else. Still posted the review 30 minutes late, while writing it in a pub as my family had lunch. Had to take the amd laptop with me to test, and it turns out downloading Borderlands 3 in the middle of nowhere is a bad idea.
Not only that, I've been finishing up other projects last week. I do what I can in the time I have. This review is 21k words and more detailed than anything else out there done by a single person currently in the middle of a vacation. If you have further complains, our publisher's link is at the bottom of the webpage. Or roll your own. What are you afraid of? I stand by my results and my work ethic.
PixyMisa - Thursday, September 17, 2020 - link
I really appreciate the effort. The individual SPEC results are vastly more useful than (for example) a single Geekbench score.Spunjji - Friday, September 18, 2020 - link
I can second that - I appreciate seeing a breakdown of the strengths/weaknesses of each core design.Kamen Rider Blade - Friday, September 18, 2020 - link
We appreaciate your hard work, I do watch your YT channel Tech Tech Potato. That being said, if you knew about this issue, with not comparing like for like; then just omit the 28 W scores from the Intel machine and just focus on Intel's 15W vs AMD's 15W.Why even include the 28W on the chart? You know how this makes you and Anandtech look, right? The issues of bias towards or against any entity could've been easily avoided if you had "Like for like" scores across the board. That's part of what Steve from Gamers Nexus and many of us enthusiast see's as "Bias Marketing" or "Paid Shilling" to manipulate results in one way or another. Many people can easily interpret your data of not showing "like for like" in many wrong ways when they have no context for it.
If you didn't want to test AMD's 25 watt scores, nobody would care, just don't bring up Intel's equivalent 28 watt scores. Alot of the more casual readers won't look at the details and they can easily mis-interpret things. I prefer that your good name doesn't get dragged down in mud with a simple omission of certain benchmark figures. I know you wouldn't deliberately do that to show bias towards one entity or another, but will other folks know that?
Spunjji - Friday, September 18, 2020 - link
Presenting the figures he has isn't bias. Bias would be proclaiming Intel to be the winner without noting the discrepancy, or specifically choosing tests to play to the strength of one architecture.As it is, the Lenovo device doesn't do a 25W mode, so you're asking him to add a full extra device's worth of testing to an already long review. That's a bit much.
If you take a look at the 65W APU results and compare them, you'll see a familiar story for Renoir - there's not actually a whole lot of extra gas in the tank to be exploited by a marginally higher TDP. It performs spectacularly well at 15W, and that's that.
Kamen Rider Blade - Friday, September 18, 2020 - link
You can literally just omit the 65W APU, it has no relevance to be on that chart.Ok, if that Lenovo LapTop doesn't offer a 25W mode, fine. Maybe Hardware Unboxed got a different model of LapTop for the 4800U. Then don't present Intel's 28W mode.
That's how people misunderstand things when there is a deliberate omission of information or extra information that the other side doesn't happen. The lack of pure like for like causes issues.
Spunjji - Saturday, September 19, 2020 - link
You're *demanding bias*. They had the Intel device with a 28W mode, 28W figures are a big part of the TGL proposition, so they tested it and labelled it all appropriately. That isn't bias.The "lack of pure like for like" only causes issues if you don't really pay attention to what the article says about what they had and how they tested it.