Intel Beast Canyon NUC Review: Desktop Tiger Lake Debuts in SFF Gaming Powerhouse
by Ganesh T S on July 29, 2021 9:00 AM EST- Posted in
- Systems
- Intel
- NUC
- Tiger Lake
- NUC11
- Beast Canyon
Power Consumption and Thermal Performance
The power consumption at the wall was measured with a 4K display being driven through the HDMI port of the discrete GPU. In the graphs below, we compare the idle and load power of the Intel NUC11BTMi9 (Beast Canyon) with other similar PCs evaluated before. For load power consumption, we ran the AIDA64 System Stability Test with various stress components, as well as the artificial power virus test involving Prime95 and Furmark. The maximum sustained power consumption at the wall was recorded.
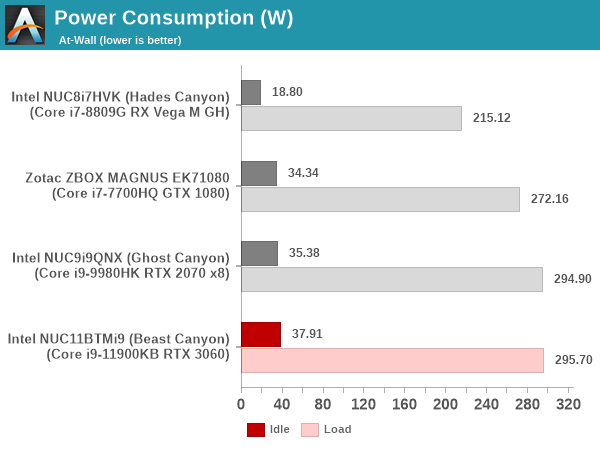
The numbers are very similar to the ones obtained for the Ghost Canyon NUC.
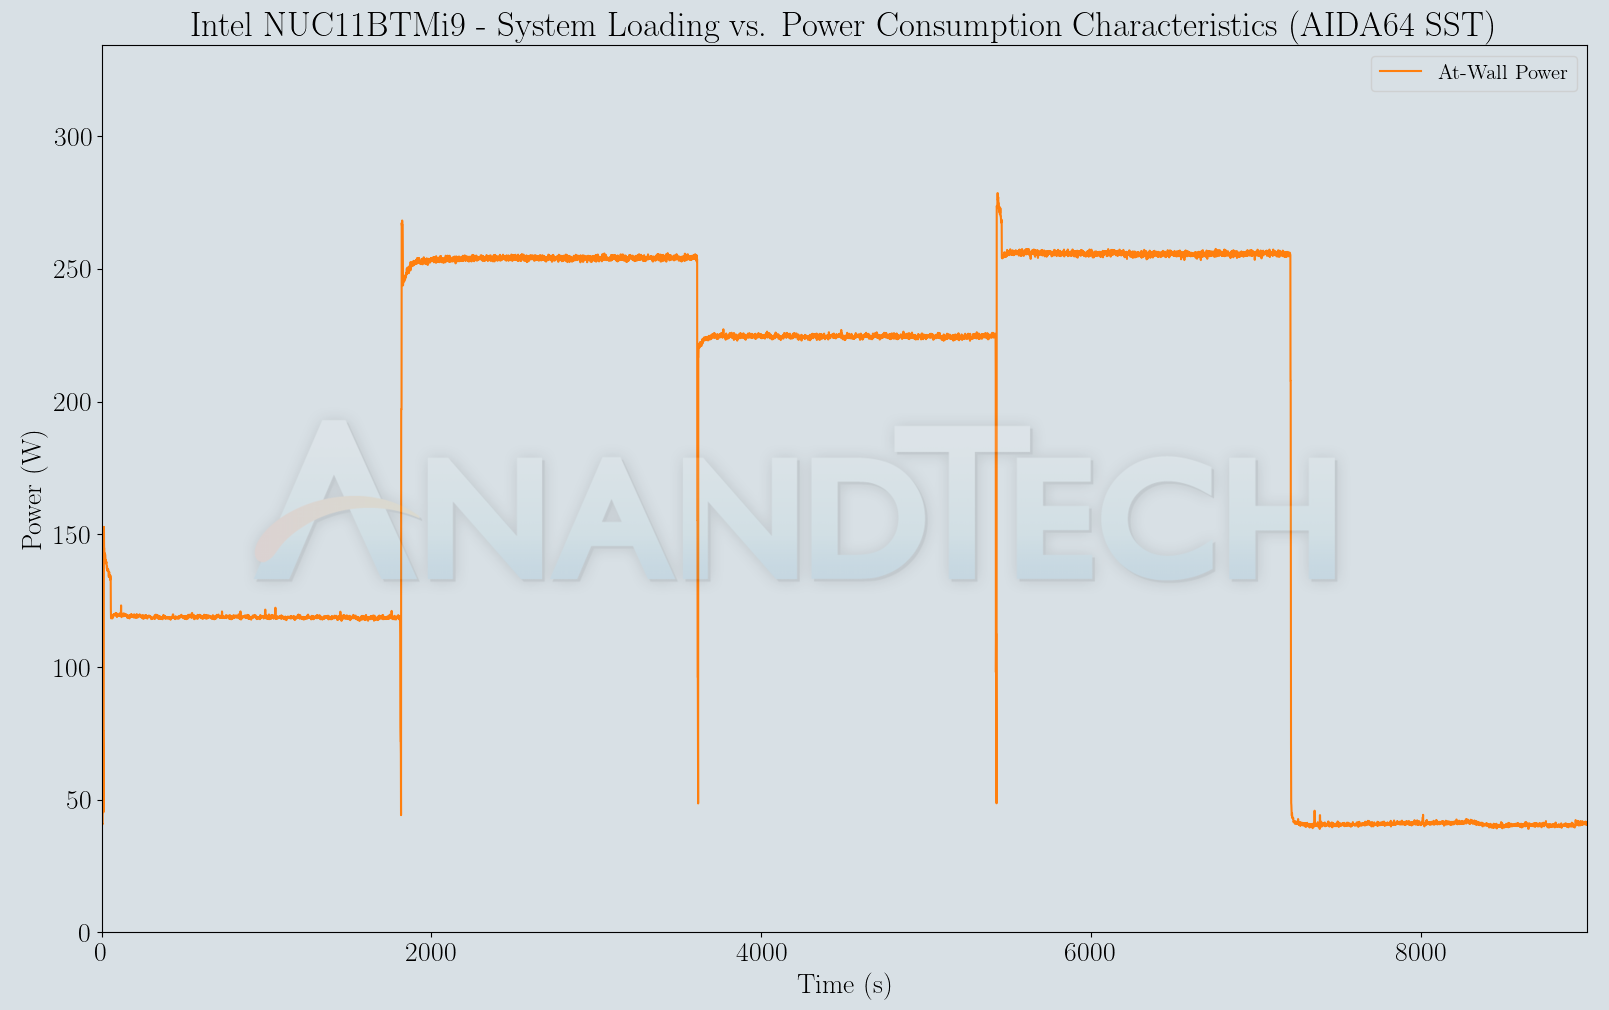
Our thermal stress routine starts with the system at idle, followed by four stages of different system loading profiles using the AIDA64 System Stability Test (each of 30 minutes duration). In the first stage, we stress the CPU, caches and RAM. In the second stage, we add the GPU to the above list. In the third stage, we stress the GPU standalone. In the final stage, we stress all the system components (including the disks). Beyond this, we leave the unit idle in order to determine how quickly the various temperatures in the system can come back to normal idling range. The various temperatures and power consumption number for the system during the above routine are presented in the graphs below.
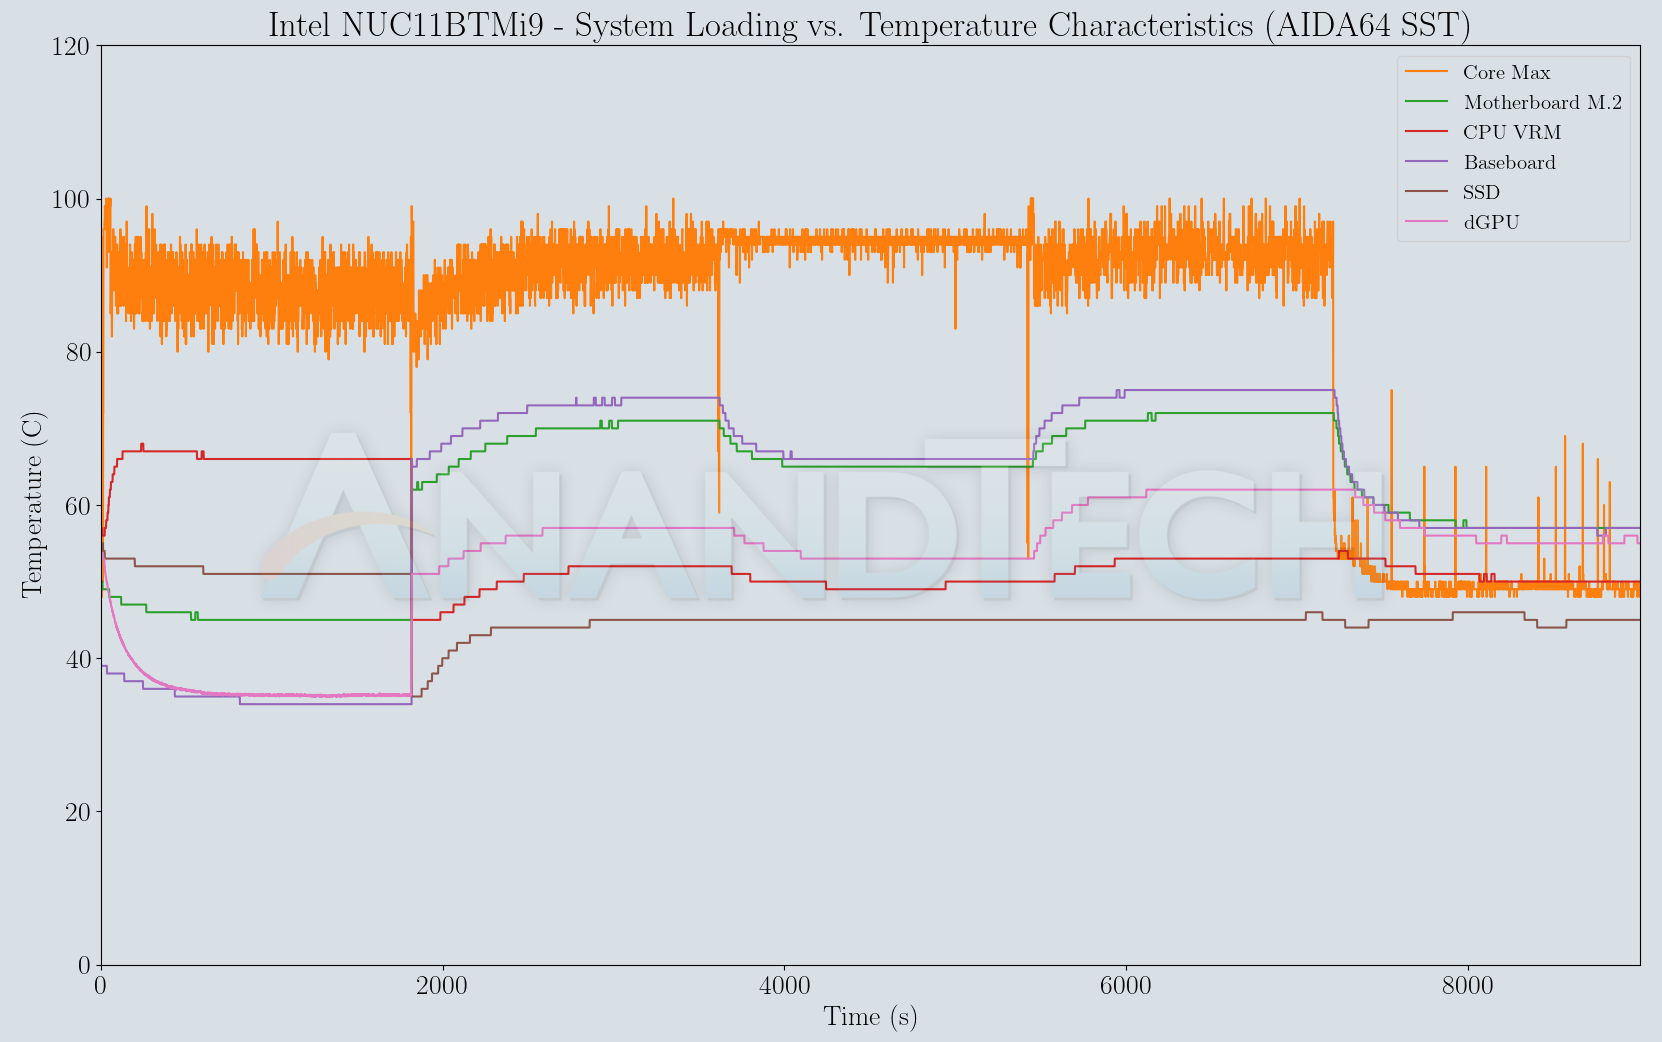
While the CPU package manages to stay below the junction temperature during the system stability test, it does hover very close to the limits. This is likely due to the fans not taking effect soon enough, as the BIOS tries to maintain a balance between noise levels and cooling efficiency. It is likely that the production BIOS will need to sacrifice some noise levels for better thermals. Despite significant loading on the SSD, the thermal solution is good enough to keep the temperature below 75C.
A similar test routine is conducted with Prime95 running in maximum power consumption mode for 30 minutes, followed by the addition of a FurMark stress workload for another 30 minutes. After a cumulative run time of a hour, the Prime95 workload is removed, and FurMark allowed to proceed for another 30 minutes. The system is then left idle for another half an hour. The metrics tracked in the AIDA64 SST case are also tracked here.
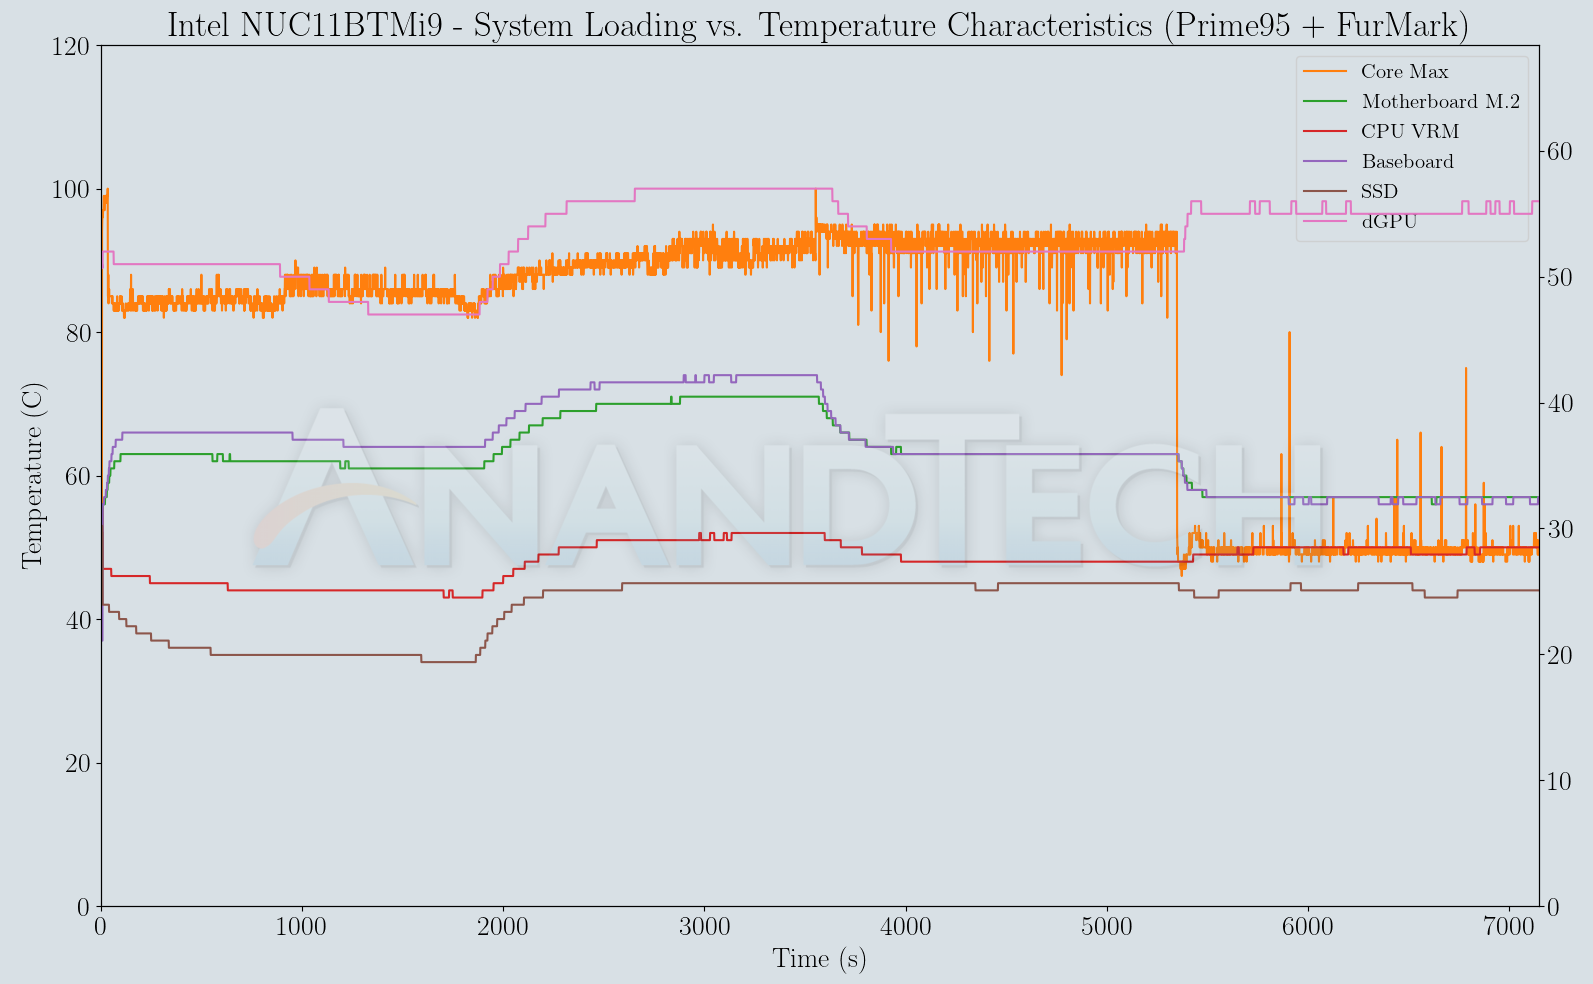

The artificial power virus test significantly amps up the power consumption when both Prime95 and Furmark are simultaneously active. The GPU temperature is also a bit toasty and seems to suffer some after-effects of the Furmark loading. However, the core temperature quickly falls down to around 50C, thanks to the well-ventilated chassis and the three fans on the top panel.


84 Comments
View All Comments
Oxford Guy - Wednesday, August 11, 2021 - link
‘It is likely that the production BIOS will need to sacrifice some noise levels for better thermals.’Haha.
Hixbot - Saturday, August 14, 2021 - link
I point this out on all SFF reviews on this site, but it seems it falls on deaf ears: We need noise measurements and comparisons.(pun intended)
yacoub35 - Saturday, August 21, 2021 - link
Agree - noise measurements please!yacoub35 - Saturday, August 28, 2021 - link
Are the "case" fans on this easily replaceable if they fail?