A Lighter Touch: Exploring CPU Power Scaling On Core i9-13900K and Ryzen 9 7950X
by Gavin Bonshor on January 6, 2023 8:00 AM EST- Posted in
- CPUs
- AMD
- Intel
- 65W
- TDP
- Ryzen 9 7950X
- Core i9-13900K
- Power Scaling
- Efficiency
- 105W
- 125W
- 253W
- 230W
- PPT
One of the biggest running gags on social media and Reddit is how hot and power hungry CPUs have become over the years. Whereas at one time flagship x86 CPUs didn't even require a heatsink, they can now saturate whole radiators. Thankfully, it's not quite to the levels of a nuclear reactor, as the memes go – but as the kids say these days, it's also not a nothingburger. Designing for higher TDPs and greater power consumption has allowed chipmakers to keep pushing the envelope in terms of performance – something that's no easy feat in a post-Dennard world – but it's certainly created some new headaches regarding power consumption and heat in the process. Something that, for better or worse, the latest flagship chips from both AMD and Intel exemplify.
But despite these general trends, this doesn't mean that a high performance desktop CPU also needs to be a power hog. In our review of AMD's Ryzen 9 7950X, our testing showed that even capped at a these days pedestrian 65 Watts, the 7950X could deliver a significant amount of performance at less than half its normal power consumption.
If you'll pardon the pun, power efficiency has become a hot talking point these days, as enthusiasts look to save on their energy bills (especially in Europe) while still enjoying fast CPU performance, looking for other ways to take advantage of the full silicon capabilities of AMD's Raphael and Intel's Raptor Lake-S platforms besides stuffing the chips with as many joules as possible. All the while, the small form factor market remains a steadfast outpost for high efficiency chips, where cooler chips are critical for building smaller and more compact systems that can forego the need for large cooling systems.
All of this is to say that while it's great to see the envelope pushed in terms of peak performance, the typical focus on how an unlocked chip scales when overclocking (pushing CPU frequency and CPU VCore voltages) is just one way to look at overall CPU performance. So today we are going to go the other way, and to take a look at overall energy efficiency for users – to see what happens when we aim for the sweet spot on the voltage/frequency curve. To that end, today we're investigating how the Intel Core i9-13900K and AMD Ryzen 9 7950X perform at different power levels, and to see what kind of benefits power scaling can provide compared to stock settings.
The Ever Changing Definition of TDP (Thermal Design Power)
One of the most frustrating talking points surrounding processors involves TDP, or more specifically, what TDP even is. While the term has a fixed definition – Thermal Design Power – what that actually means in regards to the specifications of a product varies from one hardware maker to the next. Even Intel and AMD have slightly different definitions of TDP (despite sharing the x86 CPU market), which makes it a complicated and at-times confusing term. In short, TDP is no longer an unflinching guide to the maximum power consumption from a specific processor – or even how much heat energy can dissipate from a processor
This is is a matter we have given plenty of column inches to over the years, so below are some previous articles on the subject of power and TDP:
- Why Intel Processors Draw More Power Than Expected: TDP and Turbo Explained
- Talking TDP, Turbo, and Overclocking: An Interview with Intel Fellow Guy Therien
Starting with Intel, while the company assigns official TDP figures to its processors, the reality is that their unlocked processors are not limited to one assigned power figure. At best, Intel offers a set of TDP values based around the base frequency of their chips, while power level 1 (PL1) and power level 2 (PL2) ratings are laid on top of that to define the power parameters for those all-important (and all-advertised) turbo clock speeds.
Meanwhile, looking at how AMD defines its TDP figures has been made more difficult with the release of its Ryzen 7000 series processors and the accompanying AM5 platform. While AMD does give out default TDP figures the Ryzen 7000 series, this is no more a hard ceiling than it is with Intel; the other element is what AMD calls Package Power Tracking, or PPT for short. The defined TDP value is assigned to its processors based on default frequency levels, while PPT is defined as the limitation to what the actual socket can deliver in terms of power (and what flagship chips tuned for maximum performance will try to consume).
The long and short of matters is that, on practically any consumer-level motherboard paired with an adequate cooler, using any unlocked processor, including the two we're focusing on today, will circumvent the chip's base TDP rating in order to provide the highest turbo clock speeds possible, capped only by the temperature and electrical delivery limits. So taking the Ryzen 9 7950X as an example, although the default TDP is 170 W, the actual PPT wattage is defined as 230 W (with a sustained current of 160 A).
The good news, however, is that these power limits are easily user-adjustable on both AMD and Intel platforms. Many motherboards for both platforms offer a plethora of adjustable values to raise and lower these limits, and even within Windows there are software packages like AMD's Ryzen Master and Intel's XTU that can make the necessary changes.
Finding The Sweet Spot Balance Between Performance, Power, and Heat
For its latest series of processors, AMD is offering a new feature called ECO Mode, which reduces a 170 W TDP-rated processor to 105 W (and a 105 W TDP-rated processor down to 65 W). When we reviewed the AMD Ryzen 9 7950X processor, we found some interesting results when using it at 65 W instead of its default value of 170 W.

The most important thing we observed was that at 65 W, the Ryzen 9 7950X processor outperformed the Intel Core i9-12900K at default settings in the CineBench R23 multi-threaded test, which is nothing short of impressive. Since then, Intel released its 13th Gen Core series codenamed Raptor Lake, so the overall playing field has been leveled some. But still, it shows the potential value in dialing down the power consumption of a flagship CPU, as the 7950X was able to deliver 80% of its peak performance at under half the power consumption.
Those findings, in turn, inspired the thesis behind this doing this article: we wondered how both the Core i9-13900K and Ryzen 9 7950X performed when using it with various power restrictions applied. So for this article, we're going ahead and testing just that situation, running AMD and Intel's flagship CPUs are various power levels.
We've selected several power limits/PPTs to test, including the following:
- Intel Core i9-13900K at default settings (125 W base, 253 W turbo)
- AMD Ryzen 9 7950X at default settings (170 W base, 230 W PPT)
- Both at 125 W
- Both at 105 W
- Both at 65 W
- Both at 35 W
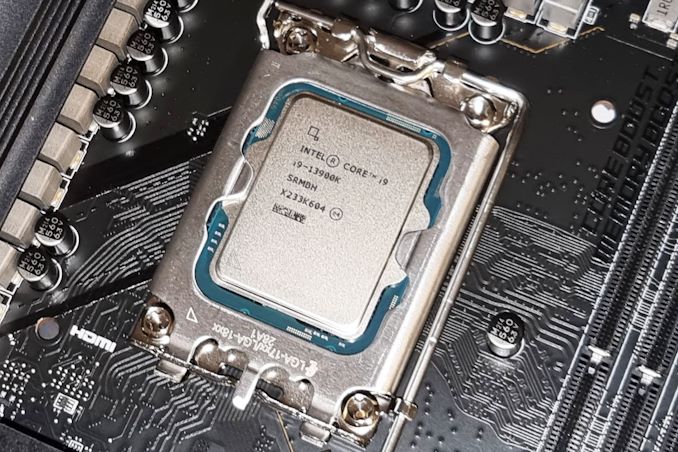
Throughout all of this, it's important to note that the Intel Core i9-13900K and AMD Ryzen 9 7950X have a critical distinction in terms of construction: chiplets. Whereas the Core i9-13900K is a monolithic design with cache, core, memory controller (IMC), and iGPU all being built within a single die, AMD's Ryzen 9 7950X is built upon a chiplet design. As a result, the 7950X uses three different chiplets for all of its major functions, with two eight-core core complex dies (CCD) and one IO die (IOD) containing the memory controller, PCIe, and graphics.
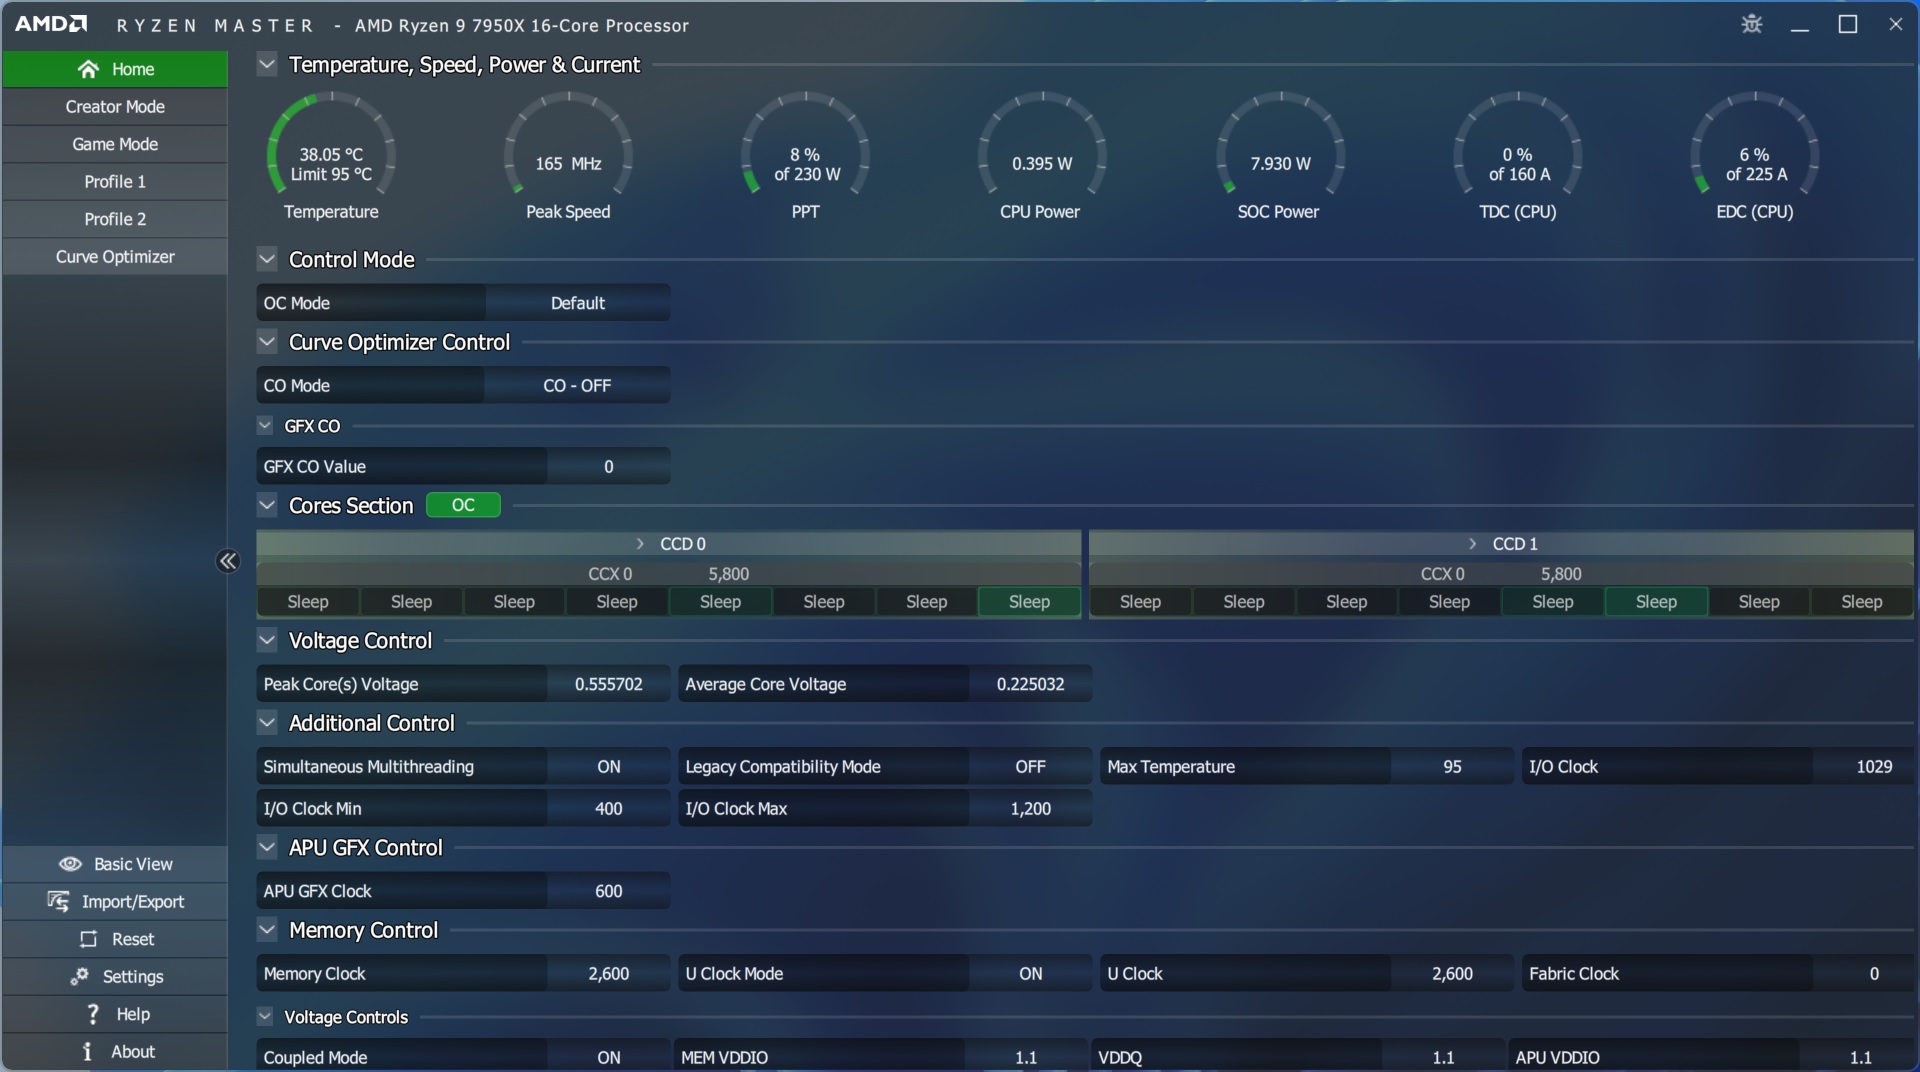
A screenshot from AMD's Ryzen Master Overclocking software during testing
This means that when setting a defined power limited with the Core i9-13900K, it's limiting power from all of the variables as mentioned. Whereas doing the same on the Ryzen 9 7950X wouldn't yield the quite same effect, as the IOD and CCDs operate semi-independently, albeit through AMD's Infinity Fabric interconnect. To properly limit the power on the Ryzen 9 7950X, the Package Power Tracking limit would need to be applied to constrict the power limits properly, such as setting a value of 125 W on the PPT and not just on the CPU cores.
Test Bed and Setup
Since both Intel and AMD use different platforms and sockets, we're using the MSI MPG Z790 Carbon WIFI for the Core i9-13900K and the GIGABYTE X670E Aorus Master for the Ryzen 9 7950X. To try and keep things on a level playing field, we're using an SK Hynix Platinum P41 2TB NVMe storage drive and AMD Radeon RX 6950 XT graphics card.
Normally we would rely on JEDEC memory settings defined by each platform, but in this case, we've opted to test both platforms with the same SK Hynix DDR5-5600B CL46 memory configuration. This is the memory we used for the Intel Core i9-13900K review, but it's faster than the highest official JEDEC settings supported by AMD's Ryzen 7000 series platform (DDR5-5200). Either way, we wanted to make our comparisons as apples-to-apples as possible, including holding memory at a constant performance and power level to investigate the benefits (if any) of restricting system power draw.
| Power Scaling Test Bed (DDR5) Intel & AMD |
|
| CPUs | Core i9-13900K ($589) 24 Cores, 32 Threads 125 W Base, 253 W Turbo Ryzen 9 7950X ($699) 16 Cores, 32 Threads 170 W Base, 230 W PPT |
| Motherboards | MSI MPG Z790 Carbon WIFI (13900K) GIGABYTE X670E Aorus Master (7950X) |
| Memory | SK Hynix 2x16 GB DDR5-5600B CL46 |
| Cooling | EKWB EK-AIO Elite 360 D-RGB 360mm |
| Storage | SK Hynix Platinum P41 2TB PCIe 4.0 x4 |
| Power Supply | Corsair HX1000 |
| GPUs | AMD Radeon RX 6950 XT, 31.0.12019 |
| Operating Systems | Windows 11 22H2 |
Regarding benchmarks, we've opted for a small selection of rendering and encoding tests as we believe these will highlight differences in processor performance at the different power levels. For gaming, we've opted for Total War: Warhammer 3, as this is a notoriously heavily CPU-dependent title, while Borderlands 3 is more graphically demanding. We thought it would be prudent to test one of each, although if anyone would like to request more titles from our CPU 2023 benchmarking suite, feel free, and we'll add data as we find the time to collect and collate it.


61 Comments
View All Comments
ABR - Thursday, January 12, 2023 - link
Still, they could make the high-power mode opt-in rather than the other way around. Like the old turbo buttons.hMunster - Friday, January 6, 2023 - link
You say that Intel loses more performance when scaling down - but on the other hand Intel also seems to adhere to lower limits more than AMD, so what's really going on?If the Intel at 65W setting consumes much less than the AMD at the same 65W setting then the whole comparison needs to be changed to use actual power draw, not the configured one!
Redbbull - Friday, January 6, 2023 - link
On our Cinebench R15 test, which includes both single-core and multi-core workflows, the Ryzen 9 far outpaces the Core i9 when it's using all of its cores and threads.Josh128 - Friday, January 6, 2023 - link
Why in the world are you using blue for the AMD graphs and orange for the Intel? Also, this test would be so much better if you used CPU socket power draw (PPT for AMD, not sure of the Intel equivalent) to make the measurements.Gavin Bonshor - Friday, January 6, 2023 - link
I did use PPT for AMD, but why they are going above that threshold is something I need to test on more boards, which I need some time for.And the color of the graphs wasn't a concern to me, but if it appeases you/others, I'm more than happy to change them over when I've spent some much-needed time with my children (I'm already working over the weekend as it is).
cyrusfox - Friday, January 6, 2023 - link
We call can wait for that, family first. Thank you so much for this. Pretty shocking to me, AMD appears to win at all power match settings. My only concern is AMD is actually using more power then advertised, so understanding that or putting in a correction ratio to understand true watt to watt comparison would help Intel but looks like they are still going to come up short.Thank you much for this original content!
Farfolomew - Friday, January 6, 2023 - link
Not that history always repeats itself, but this current GhZ war and TDP ramping-up is reminiscent of the circa ~2005 with Pentium 4 Prescott and then Pentium Dual Core as well. The only way Intel back then were able to compete and beat Athlon 64 was on the GhZ path.Perhaps Meteor lake can bring the TDP back down to sensible levels with huge increases in IPC and efficiency gains much like the Core 2 Duo did?
In that case, what does AMD have planned to compete with that? They'll also need to significantly raise their IPC while dropping clocks to compete
Gavin Bonshor - Friday, January 6, 2023 - link
Both Intel and AMD announced 65 W SKUs due out this month, so it'll be interesting to see how that pans out performance-per-watt wiseWereweeb - Saturday, January 7, 2023 - link
Not Meteor Lake, no. We'll need GAAFETs and backside power delivery to substantially increase efficiency.But even then, I don't think the high TDP's are going anywhere. It's the cheapest and easiest way for brands to increase their performance metrics, and today every other way is extremely expensive.
Der Keyser - Friday, January 6, 2023 - link
Very interesting test and results indeed. But how much more can be had by adding undervolting into the mix? I know that moves the tests into the silicon lottery territory, but still?The tests performed all depends on - presumably - the BIOS code and voltage levels of the vendor. That may or may not be 100% according to Intel/AMDs specs. It could be really interesting to see what additonal gains could be found by undervolting across fx. Three different samples of the same CPU.