The Tesla Model S Controversy: Understanding the Effects of Temperature on Electric Vehicle Efficiency and Range
by Vivek Gowri on February 18, 2013 4:22 PM EST- Posted in
- Auto
- Electric Vehicles
- Tesla Model S
- Nissan Leaf
Thus far, plenty of ink has been spilled regarding the Tesla Model S and the fallout from the New York Times article, and it even showed up in our latest podcast. I feel like my perspective on this topic, as someone who has worked in the EV space as an engineer for the last four years, as well as driving a family owned Nissan Leaf for the last year and a half, is a bit different from our editors who discussed it, as well as most of the others who have written about it.
I’m not particularly interested in getting involved with the back and forth or analyzing what either party said - I feel like the Times reporter didn’t really understand how EVs work, nor how to drive them, and I don’t really agree with Elon Musk’s Matlab data infused response (it felt too vitriolic to get across any point other than Tesla being angry about the article). And just to go back to the point about not understanding how EVs should be driven, you have to tailor your driving style to suit the powertrain in order to get the maximum out of the EV - if you don’t want to, you’re going to be disappointed. Consider it like needing to switch keyboard shortcuts when you move from Windows to OS X - it’s a slight mental recalibration that has to happen for you to use the platform to its fullest. But that’s another story for another time.
What I feel like is getting lost here is actual EV performance in cold weather, or hot weather, or really anything in the way of hard numbers. We all know that battery performance is reduced in more extreme environmental conditions, and that all cars, regardless of powertrain type, consume more energy (fuel or battery) in those extreme climates. Unfortunately, quantifying these general ideas is a bit more difficult. That’s where I come in.
Technology Background
First, a bit of background. I spent the last few months working in Argonne National Laboratory’s Advanced Powertrain Research Facility (APRF). They’re an extremely knowledgeable group of engineers and scientists whose job it is to test advanced technology vehicles in their temperature controlled dynamometer facility, which can sustain temperatures anywhere between -5 F to 100 F. Most of this research is done as a part of the Department of Energy’s Vehicle Technology Program.
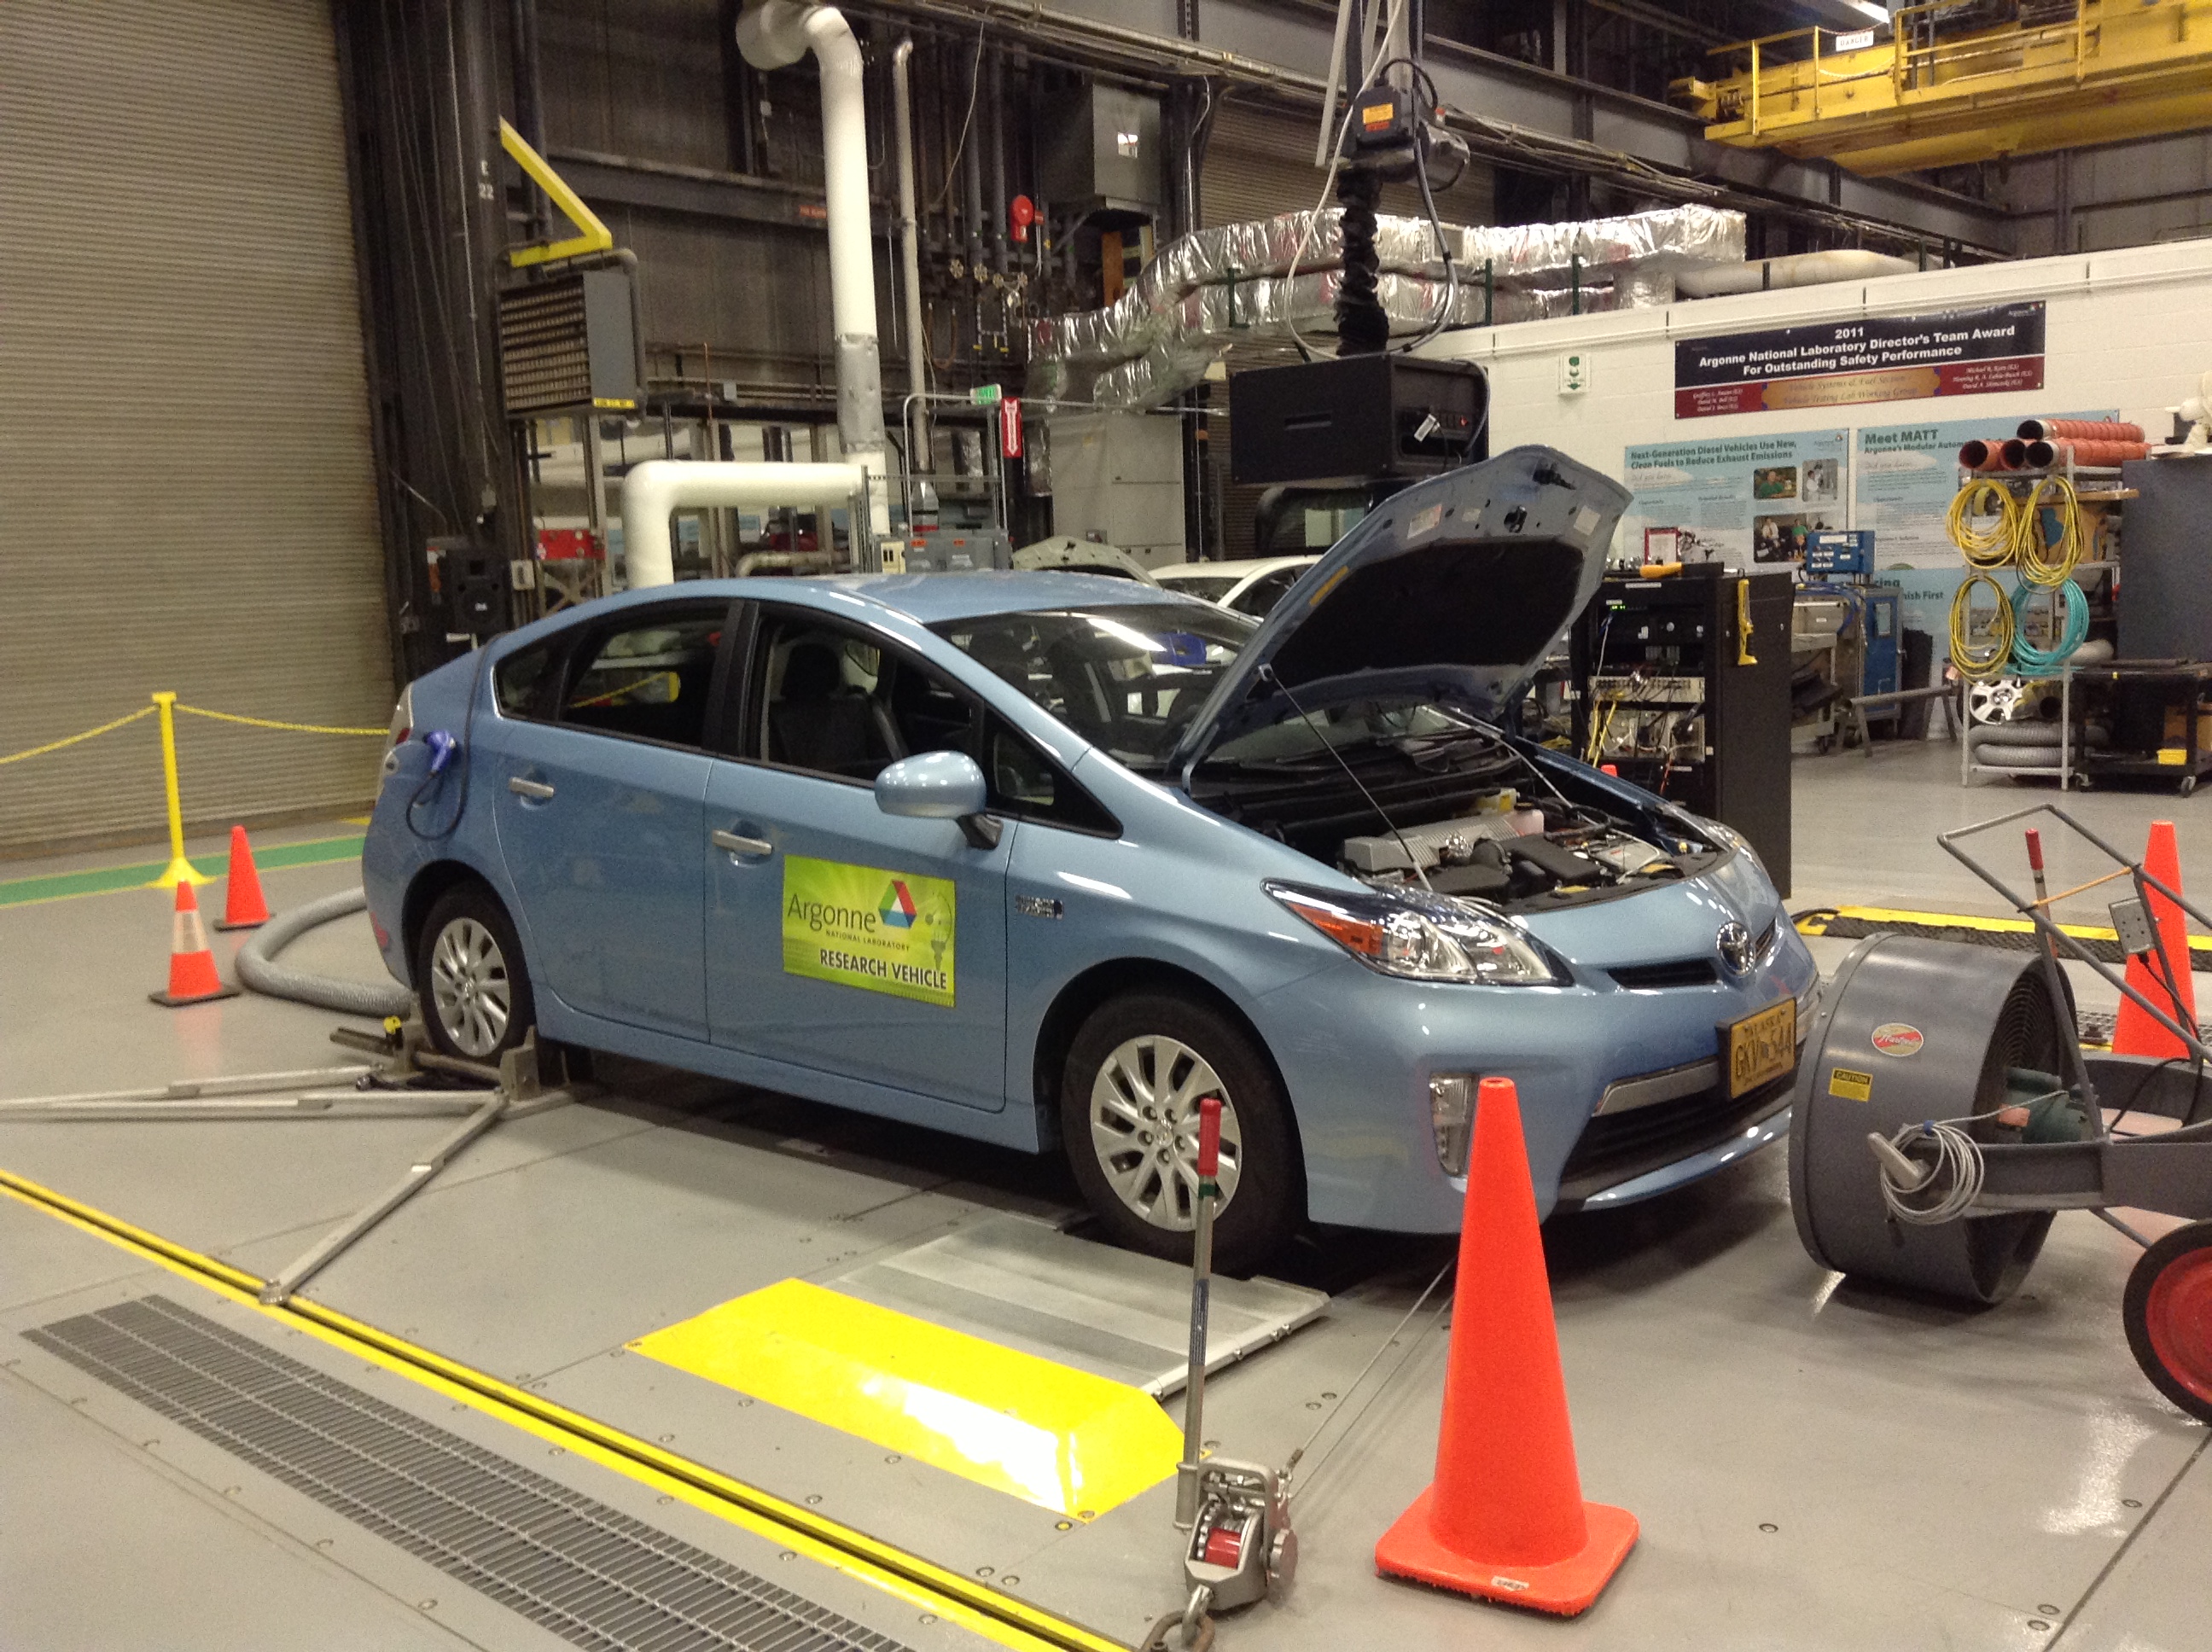
Everything from pure electrics to plug-in hybrids, normal hybrids, clean diesels, direct engine turbos, and advanced transmissions (dual-clutch, CVT, etc.) go through the labs with an extended set of instrumentation to collect various speed and consumption metrics. The resulting data sets are truly comprehensive (2 million data cells for 20 minutes on the dynamometer) and allow the researchers to draw conclusions about the various powertrains and their behavior. It’s a pretty impressive setup.
The APRF has released some of the data to the public in something called the Downloadable Dynamometer Database. The D3 pages for the Nissan Leaf includes data from the three different temperatures used in EPA’s 5-Cycle fuel economy test: 20F (with a heater load), 72F (climate control off), and 95F + sun lamps (with an air conditioning load). In all cases involving heating or air conditioning, the climate control system is set to 72F. Using this data, we can take a more in depth look at what the actual penalties of environment are on efficiency and performance, and really see the impact of temperature on energy consumption and range.
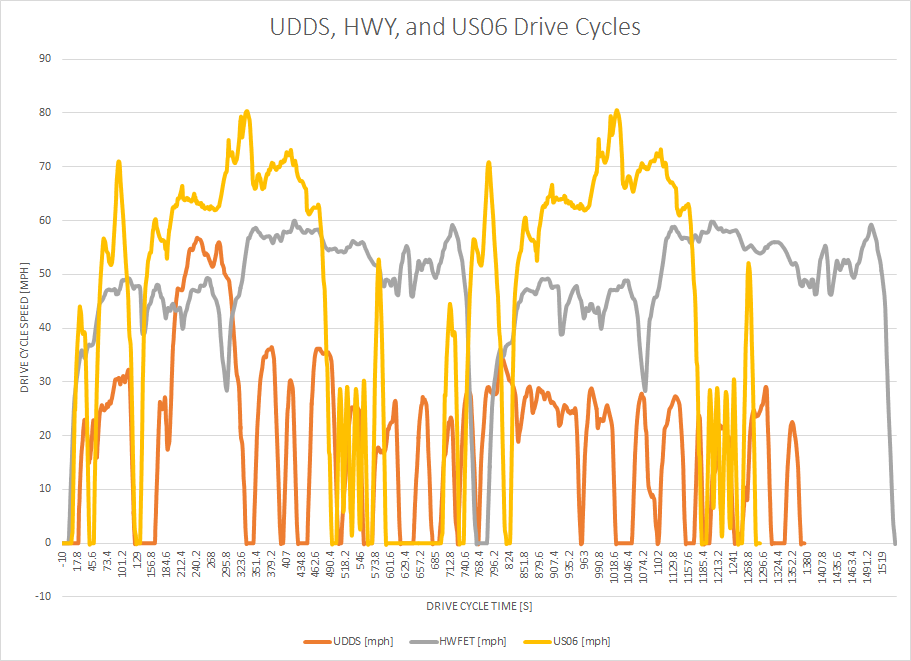
Before we start, I should probably explain the terms used in the graphs that follow. UDDS is an urban driving cycle (it stands for Urban Dynamometer Driving Schedule), CS stands for cold start (the first start after the vehicle has been sitting for a number of hours), HS is hot start (any subsequent start after the vehicle has warmed up), HWY is short for HWFET or Highway Fuel Economy Test (also seen as the Highway Fuel Economy Driving Schedule or the EPA’s highway fuel economy cycle), and US06 is a supplemental federal test procedure (SFTP) to provide a more aggressive driving schedule than the relatively tame HWFET cycle. A comparison of the three driving cycles (speed versus time) is shown above.


102 Comments
View All Comments
Buon Nasi - Monday, January 21, 2019 - link
Some car exert more energy consumption than any of the New Released. <a href="https://advancedplumbingandrooter.com/">Pl... Services</a>Buon Nasi - Monday, January 21, 2019 - link
Some car exert more energy consumption than any of the New Released https://advancedplumbingandrooter.com/