Seagate FireCuda Gaming SSD Review: RGB-Infused USB 3.2 Gen 2x2 Storage
by Ganesh T S on August 27, 2021 8:00 AM EST- Posted in
- Storage
- SSDs
- Seagate
- DAS
- ASMedia
- External SSDs
- USB 3.2 Gen 2x2
Performance Benchmarks
Benchmarks such as ATTO and CrystalDiskMark help provide a quick look at the performance of the direct-attached storage device. The results translate to the instantaneous performance numbers that consumers can expect for specific workloads, but do not account for changes in behavior when the unit is subject to long-term conditioning and/or thermal throttling. Yet another use of these synthetic benchmarks is the ability to gather information regarding support for specific storage device features that affect performance.
Synthetic Benchmark - ATTO
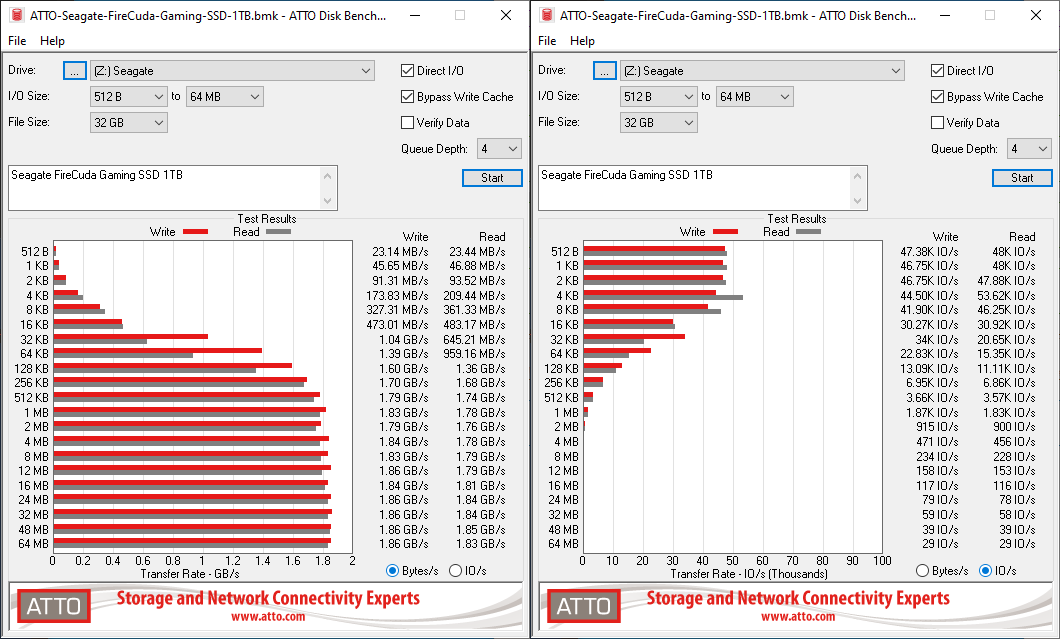
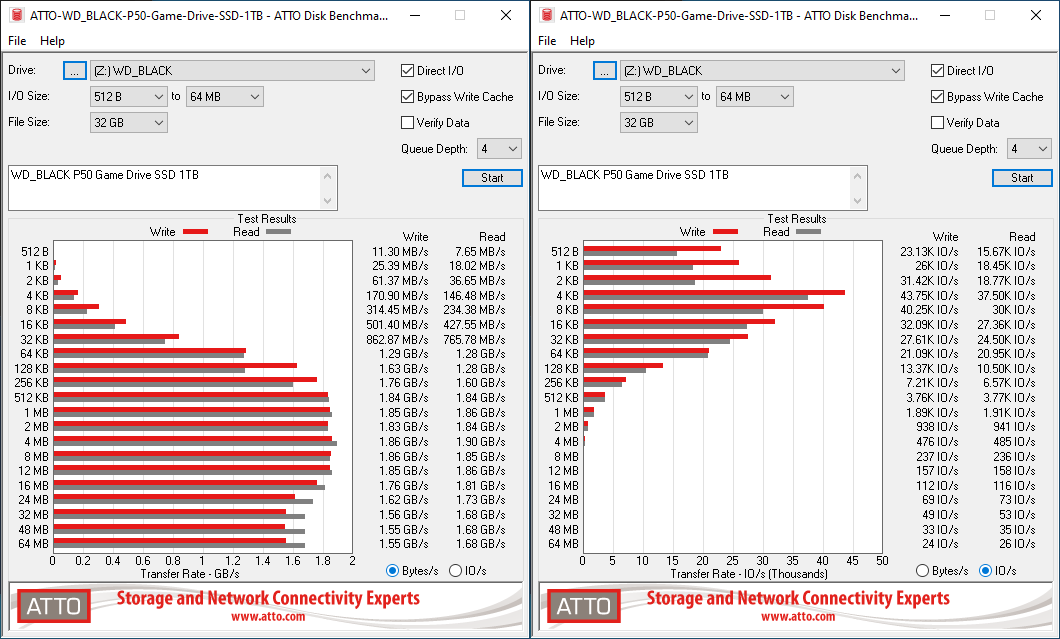
Seagate claims read and write speeds of up to 2000 MBps, and these are backed up by the ATTO benchmarks provided below. ATTO benchmarking is restricted to a single configuration in terms of queue depth, and is only representative of a small sub-set of real-world workloads. It does allow the visualization of change in transfer rates as the I/O size changes, with optimal performance being reached around 512 KB for a queue depth of 4.
| ATTO Benchmarks | |
| TOP: | BOTTOM: |
 |
|
 |
|
Synthetic Benchmark - CrystalDiskMark
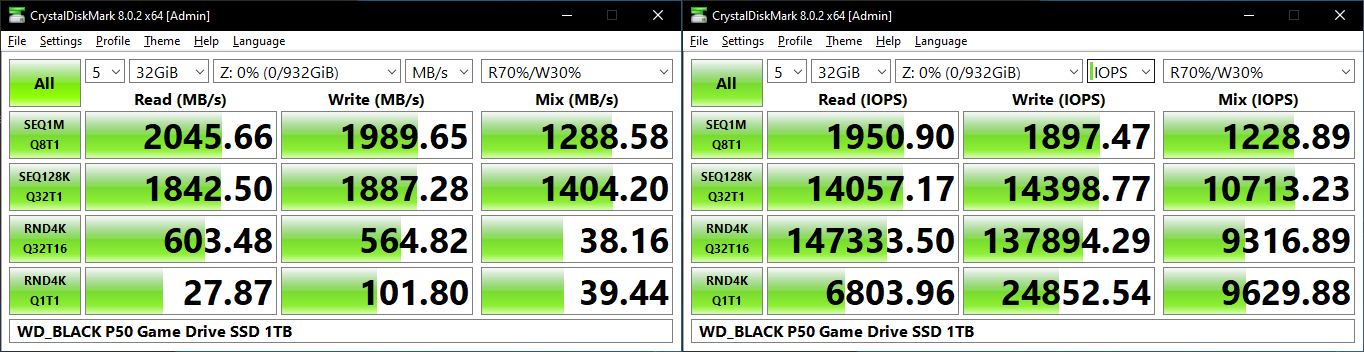
CrystalDiskMark. for example, uses four different access traces for reads and writes over a configurable region size. Two of the traces are sequential accesses, while two are 4K random accesses. Internally, CrystalDiskMark uses the Microsoft DiskSpd storage testing tool. The 'Seq128K Q32T1' sequential traces use 128K block size with a queue depth of 32 from a single thread, while the '4K Q32T16' one does random 4K accesses with the same queue configuration, but from multiple threads. The 'Seq1M' traces use a 1MiB block size. The plain 'Rnd4K' one uses only a single queue and single thread . Comparing the '4K Q32T16' and '4K Q1T1' numbers can quickly tell us whether the storage device supports NCQ (native command queuing) / UASP (USB-attached SCSI protocol). If the numbers for the two access traces are in the same ballpark, NCQ / UASP is not supported. This assumes that the host port / drivers on the PC support UASP.
| CrystalDiskMark Benchmarks | |
| TOP: | BOTTOM: |
 |
|
 |
|
The FireCuda Gaming SSD has a slight edge in the low queue depth, large-sized sequential, as well as random reads common in gaming scenarios. However, as queue depth increases, the WD_BLACK P50 returns better numbers. Fortunately for Seagate, most gaming workloads have only low queue depths - the ones in which the FireCuda Gaming SSD returns better numbers.
AnandTech DAS Suite
Our testing methodology for storage bridges / direct-attached storage units takes into consideration the usual use-case for such devices. The most common usage scenario is transfer of large amounts of photos and videos to and from the unit. Other usage scenarios include the use of the unit as a download or install location for games and importing files directly from it into a multimedia editing program such as Adobe Photoshop. Some users may even opt to boot an OS off an external storage device.
The AnandTech DAS Suite tackles the first use-case. The evaluation involves processing five different workloads:
- AV: Multimedia content with audio and video files totalling 24.03 GB over 1263 files in 109 sub-folders
- Home: Photos and document files totalling 18.86 GB over 7627 files in 382 sub-folders
- BR: Blu-ray folder structure totalling 23.09 GB over 111 files in 10 sub-folders
- ISOs: OS installation files (ISOs) totalling 28.61 GB over 4 files in one folder
- Disk-to-Disk: Addition of 223.32 GB spread over 171 files in 29 sub-folders to the above four workloads (total of 317.91 GB over 9176 files in 535 sub-folders)
Except for the 'Disk-to-Disk' workload, each data set is first placed in a 29GB RAM drive, and a robocopy command is issue to transfer it to the external storage unit (formatted in exFAT for flash-based units, and NTFS for HDD-based units).
robocopy /NP /MIR /NFL /J /NDL /MT:32 $SRC_PATH $DEST_PATH
Upon completion of the transfer (write test), the contents from the unit are read back into the RAM drive (read test) after a 10 second idling interval. This process is repeated three times for each workload. Read and write speeds, as well as the time taken to complete each pass are recorded. Whenever possible, the temperature of the external storage device is recorded during the idling intervals. Bandwidth for each data set is computed as the average of all three passes.
The 'Disk-to-Disk' workload involves a similar process, but with one iteration only. The data is copied to the external unit from the CPU-attached NVMe drive, and then copied back to the internal drive. It does include more amount of continuous data transfer in a single direction, as data that doesn't fit in the RAM drive is also part of the workload set.
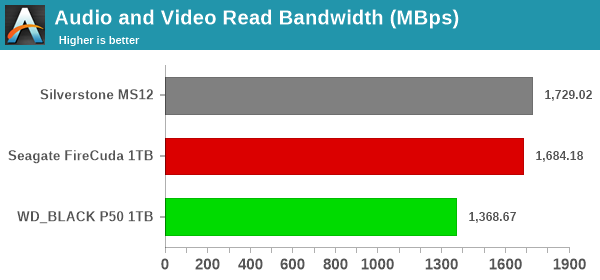
The FireCuda Gaming SSD is the clear winner in almost all write workloads (we will see the reason further down in this review). However, our robocopy read benchmarks are high queue depth / multi-threaded, since we try to copy up to 32 streams in parallel. As we saw in the CrystalDiskMark workloads, the performance suffers a bit compared to the WD_BLACK p50 in that department. The SK hynix P31, on the other hand, is a consistent performer across both types of workloads. For all practical purposes, the casual user will notice no difference between them in the course of normal usage. However, power users may want to dig deeper to understand the limits of each device. To address this concern, we also instrumented our evaluation scheme for determining performance consistency.
Performance Consistency
Aspects influencing the performance consistency include SLC caching and thermal throttling / firmware caps on access rates to avoid overheating. This is important for power users, as the last thing that they want to see when copying over 100s of GB of data is the transfer rate going down to USB 2.0 speeds.
In addition to tracking the instantaneous read and write speeds of the DAS when processing the AnandTech DAS Suite, the temperature of the drive was also recorded. In earlier reviews, we used to track the temperature all through. However, we have observed that SMART read-outs for the temperature in NVMe SSDs using USB 3.2 Gen 2 bridge chips end up negatively affecting the actual transfer rates. To avoid this problem, we have restricted ourselves to recording the temperature only during the idling intervals. The graphs below present the recorded data.
| AnandTech DAS Suite - Performance Consistency | |
| TOP: | BOTTOM: |
 |
|
 |
|
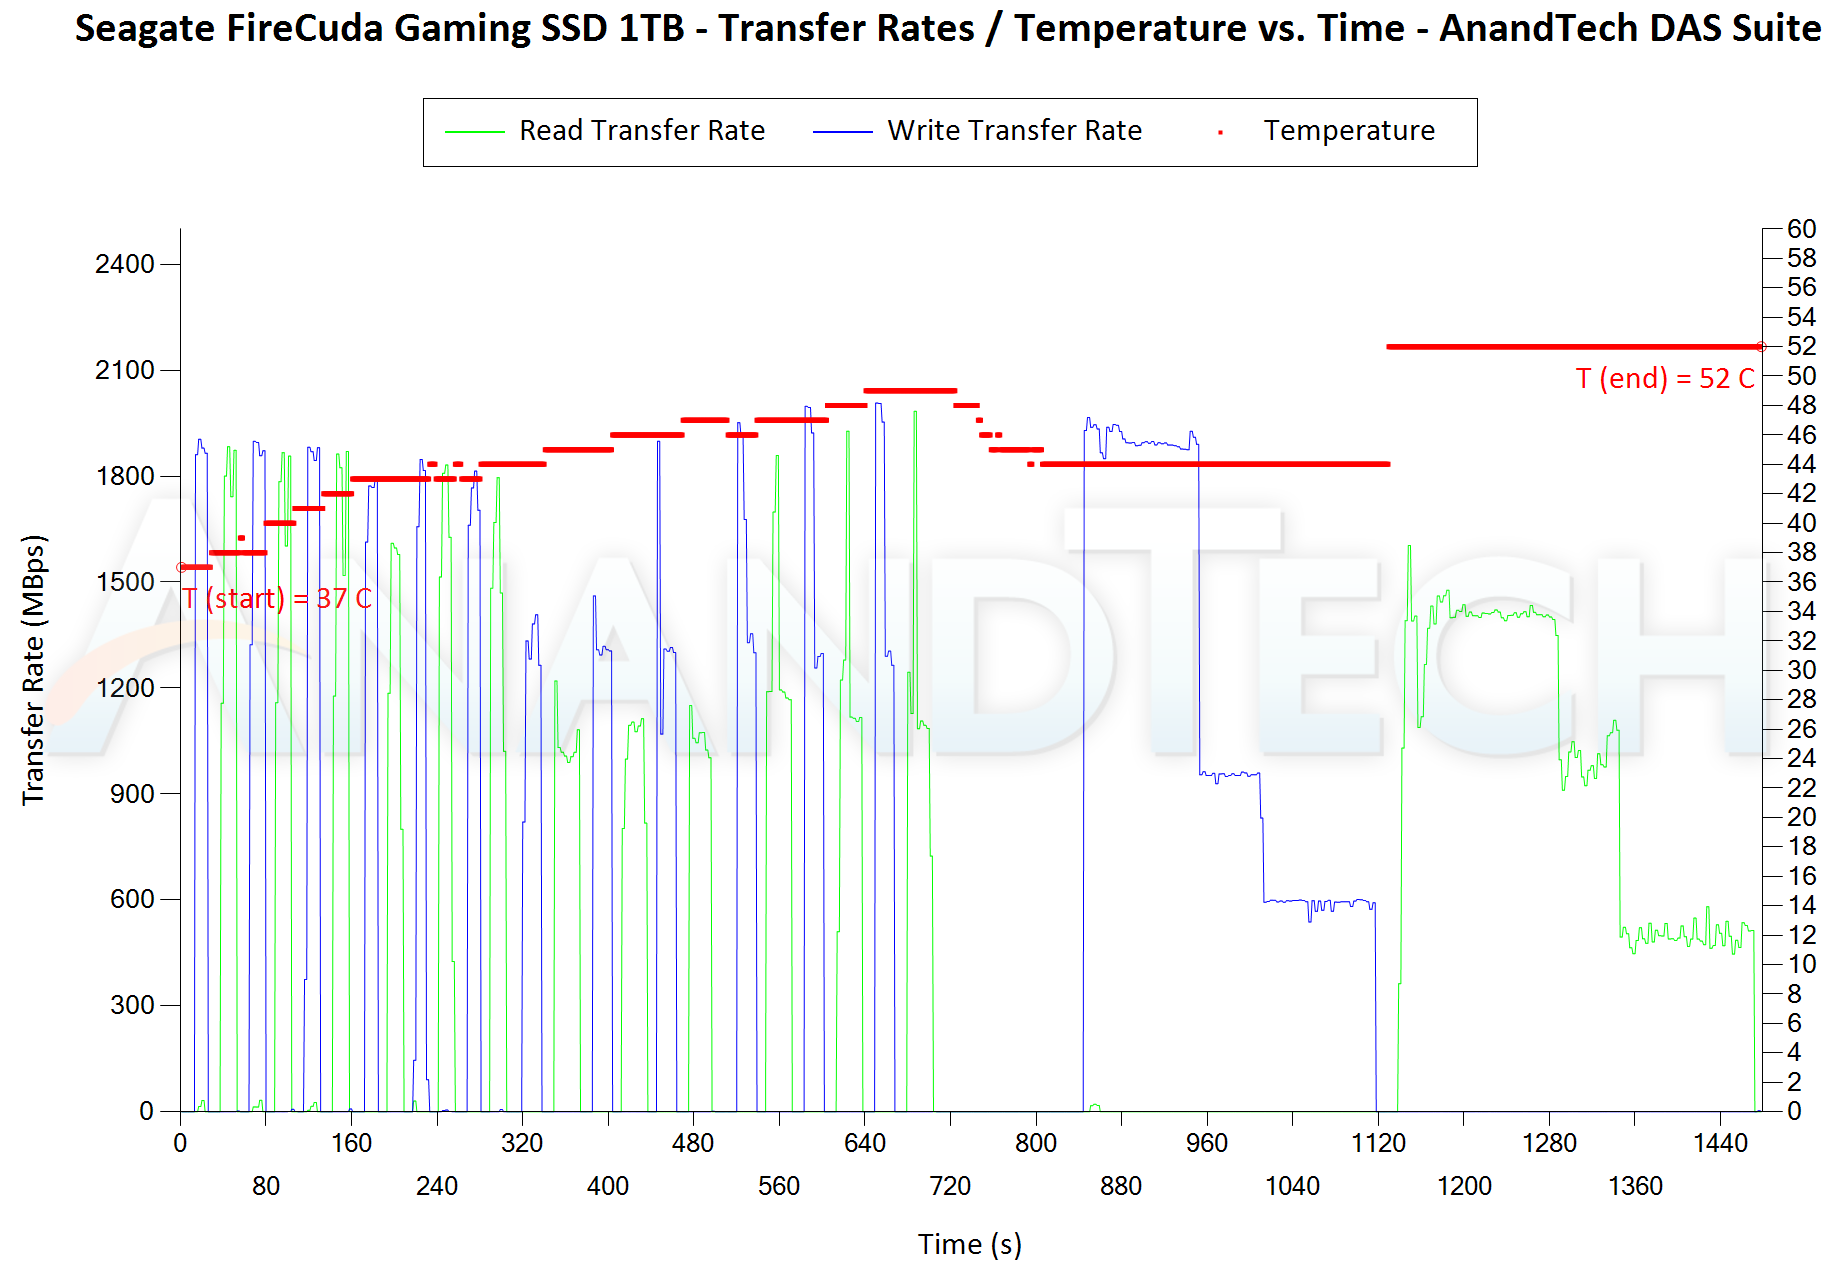
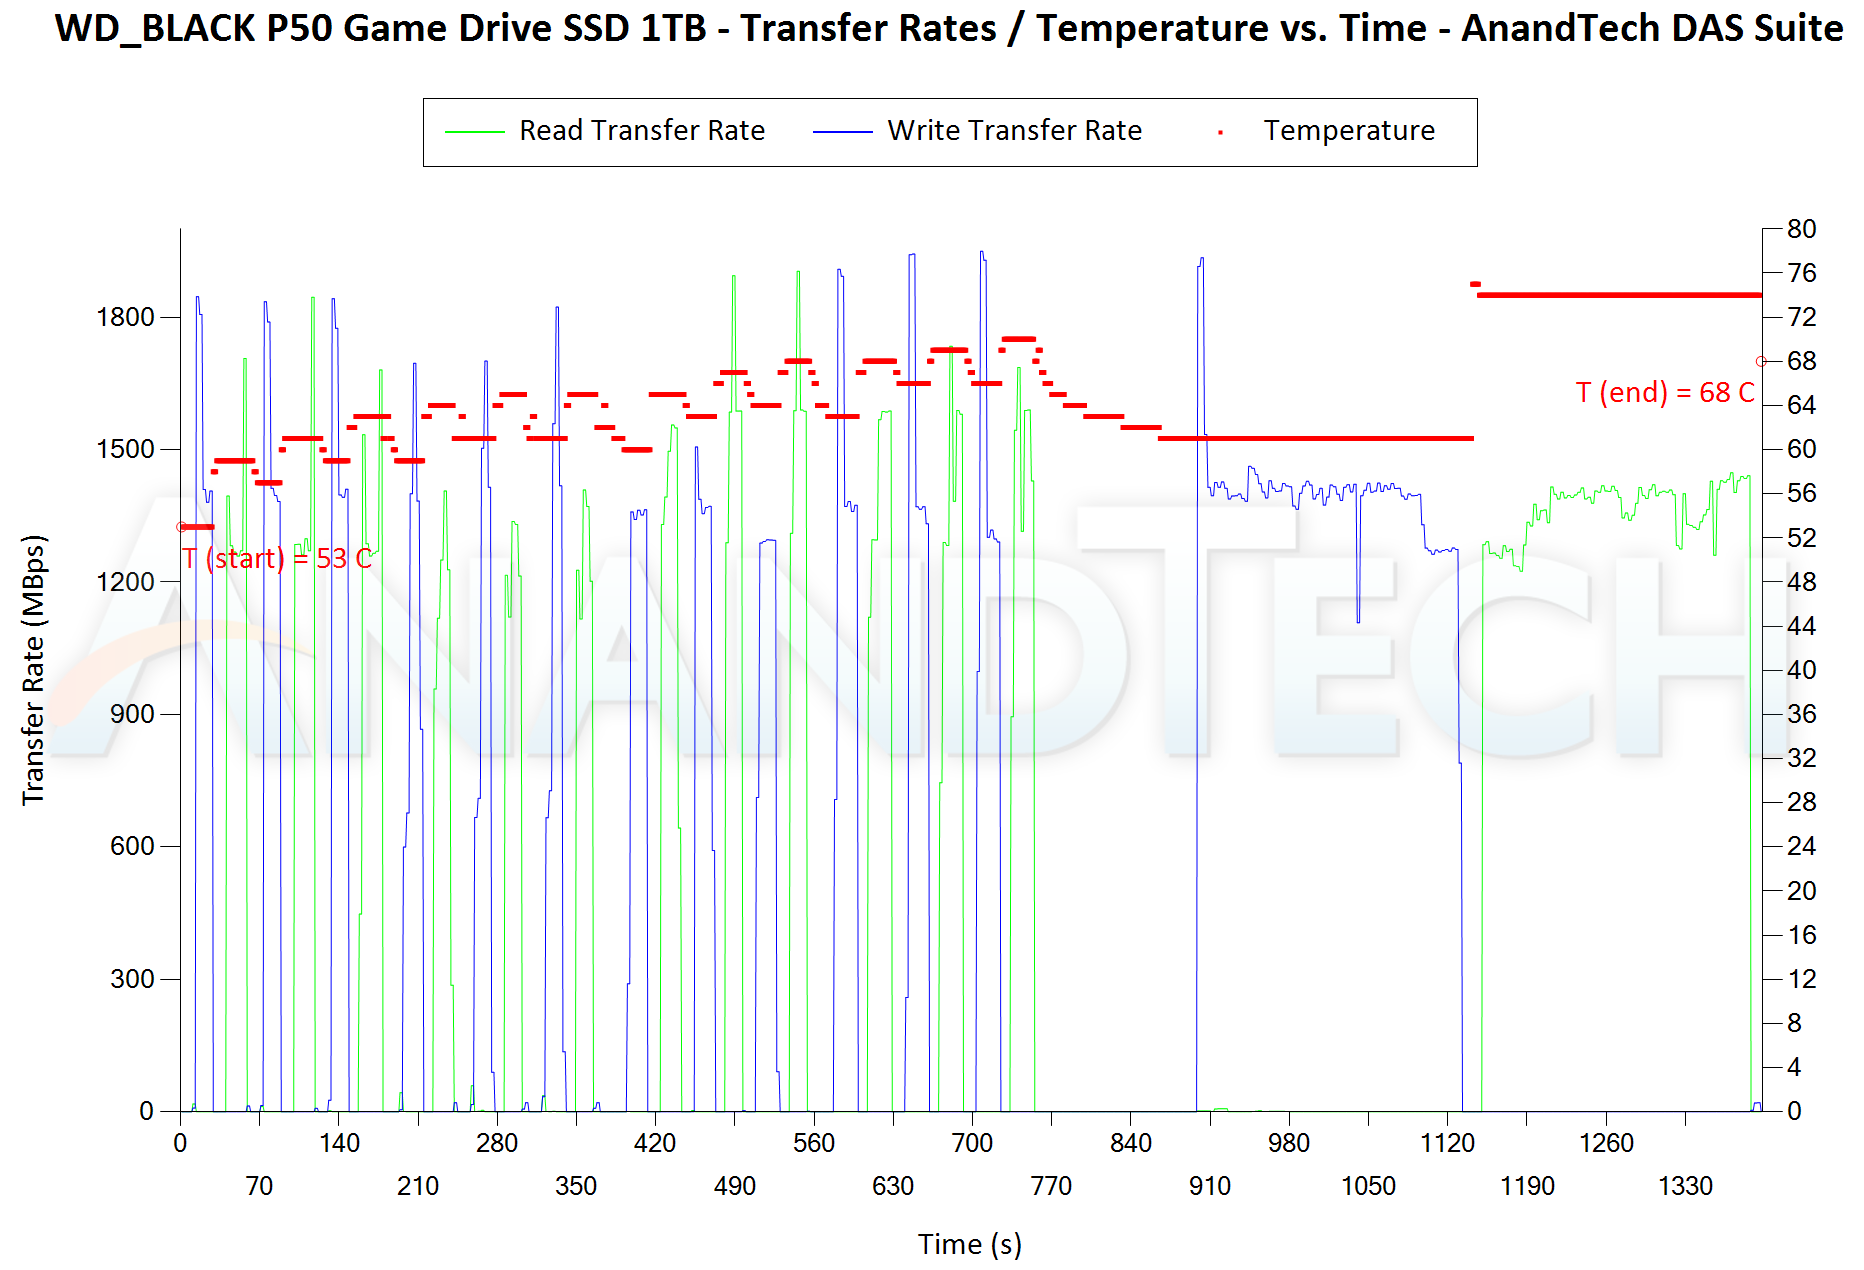
The first three sets of writes and reads correspond to the AV suite. A small gap (for the transfer of the video suite from the internal SSD to the RAM drive) is followed by three sets for the Home suite. Another small RAM-drive transfer gap is followed by three sets for the Blu-ray folder. This is followed up with the large-sized ISO files set. Finally, we have the single disk-to-disk transfer set. A closer look at the first write shows that the FireCuda Gaming SSD maintains 1800 MBps all through, but the WD_BLACK P50 has a 1.8 GBps peak but then flatlines to around 1.4 GBps. This points to a really small SLC cache that does get reclaimed fast enough (in the read interval) to service the next write set. On the other hand, the disk-to-disk transfer set (300GB+) brings the FireCuda Gaming SSD to its knees - ending up with a 600 MBps wrte speed towards the last set of files. This points to the SLC cache of the Seagate SSD being somewhat lesser than 300GB in size. On the temperature front, the Seagate SSD doesn't pass 52C at any point of time during the benchmarking. The P50, on the other hand, goes as high as 76C before settling down to 68C at the end of the benchmarking process. The P50 is at a slight disadvantage, though. The operations previous to the performance consistency test had ended up with the P50 at 53C (compared to 37C for the FireCuda).
PCMark 10 Storage Bench - Real-World Access Traces
There are a number of storage benchmarks that can subject a device to artificial access traces by varying the mix of reads and writes, the access block sizes, and the queue depth / number of outstanding data requests. We saw results from two popular ones - ATTO, and CrystalDiskMark - in a previous section. More serious benchmarks, however, actually replicate access traces from real-world workloads to determine the suitability of a particular device for a particular workload. Real-world access traces may be used for simulating the behavior of computing activities that are limited by storage performance. Examples include booting an operating system or loading a particular game from the disk.
PCMark 10's storage bench (introduced in v2.1.2153) includes four storage benchmarks that use relevant real-world traces from popular applications and common tasks to fully test the performance of the latest modern drives:
- The Full System Drive Benchmark uses a wide-ranging set of real-world traces from popular applications and common tasks to fully test the performance of the fastest modern drives. It involves a total of 204 GB of write traffic.
- The Quick System Drive Benchmark is a shorter test with a smaller set of less demanding real-world traces. It subjects the device to 23 GB of writes.
- The Data Drive Benchmark is designed to test drives that are used for storing files rather than applications. These typically include NAS drives, USB sticks, memory cards, and other external storage devices. The device is subjected to 15 GB of writes.
- The Drive Performance Consistency Test is a long-running and extremely demanding test with a heavy, continuous load for expert users. In-depth reporting shows how the performance of the drive varies under different conditions. This writes more than 23 TB of data to the drive.
Despite the data drive benchmark appearing most suitable for testing direct-attached storage, we opt to run the full system drive benchmark as part of our evaluation flow. Many of us use portable flash drives as boot drives and storage for Steam games. These types of use-cases are addressed only in the full system drive benchmark.
The Full System Drive Benchmark comprises of 23 different traces. For the purpose of presenting results, we classify them under five different categories:
- Boot: Replay of storage access trace recorded while booting Windows 10
- Creative: Replay of storage access traces recorded during the start up and usage of Adobe applications such as Acrobat, After Effects, Illustrator, Premiere Pro, Lightroom, and Photoshop.
- Office: Replay of storage access traces recorded during the usage of Microsoft Office applications such as Excel and Powerpoint.
- Gaming: Replay of storage access traces recorded during the start up of games such as Battlefield V, Call of Duty Black Ops 4, and Overwatch.
- File Transfers: Replay of storage access traces (Write-Only, Read-Write, and Read-Only) recorded during the transfer of data such as ISOs and photographs.
PCMark 10 also generates an overall score, bandwidth, and average latency number for quick comparison of different drives. The sub-sections in the rest of the page reference the access traces specified in the PCMark 10 Technical Guide.
Booting Windows 10
The read-write bandwidth recorded for each drive in the boo access trace is presented below.
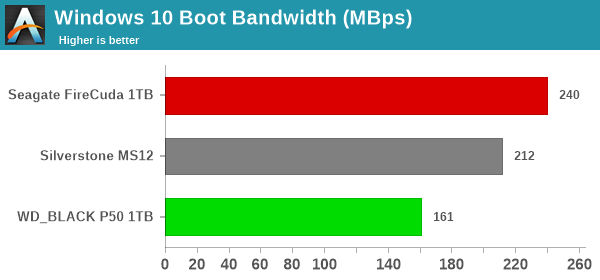
Booting Windows involves lots of low queue depth random reads, and the FireCuda is a champ in that department.
Creative Workloads
The read-write bandwidth recorded for each drive in the sacr, saft, sill, spre, slig, sps, aft, exc, ill, ind, psh, and psl access traces are presented below.
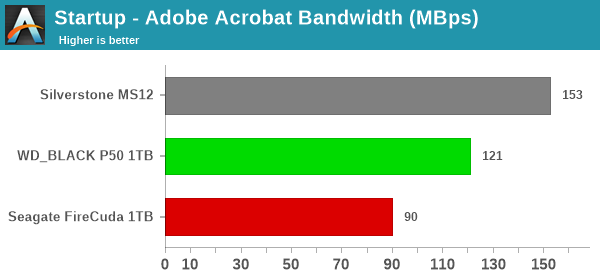
The startup and usage sequences for various applications involves different amounts of queue depths and random / sequential reads. Depending on the exact mix, the P50 edges ahead in some, while the FireCuda gets the honors in others. The SK hynix P31 comes in the middle of the pack.
Office Workloads
The read-write bandwidth recorded for each drive in the exc and pow access traces are presented below.
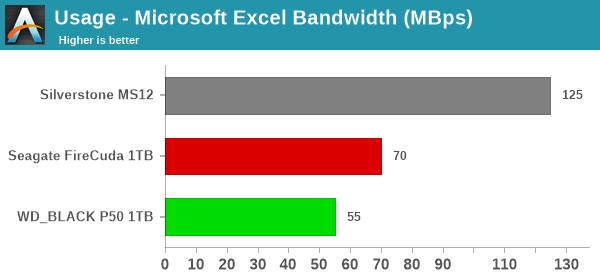
The SK hynix P31 is an all-round better performed for office workloads compared to either of the P50 or the FireCuda.
Gaming Workloads
The read-write bandwidth recorded for each drive in the bf, cod, and ow access traces are presented below.
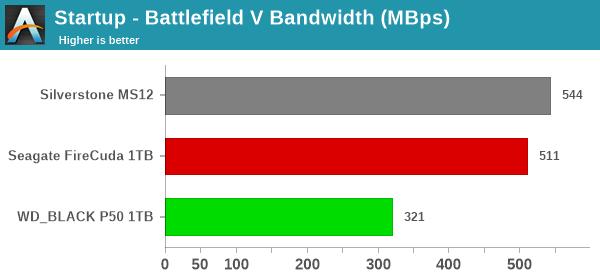
The FireCuda Gaming SSD performs way better than the P50 across all of the game startup traces, though it is actually the SK hynix P31 coming out on top in two of the three.
Files Transfer Workloads
The read-write bandwidth recorded for each drive in the cp1, cp2, cp3, cps1, cps2, and cps3 access traces are presented below.
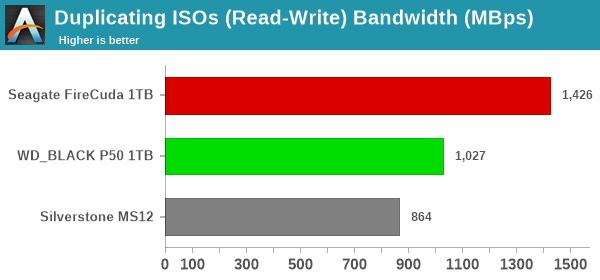
All these are low queue depth operations, and mostly sequential in nature. Since the size of the workloads is much lesser than the SLC cache of the FireCuda Gaming SSD, it is no surprise that the Seagate offering comes out on top in most of them.
Overall Scores
PCMark 10 reports an overall score based on the observed bandwidth and access times for the full workload set. The score, bandwidth, and average access latency for each of the drives are presented below.
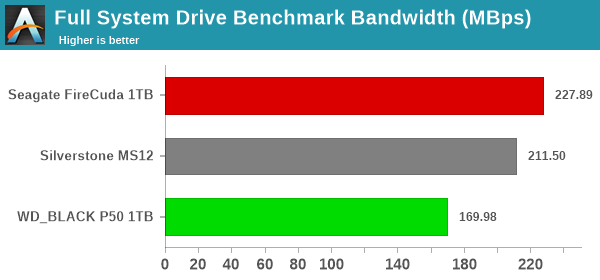
Overall, the Seagate FireCuda Gaming SSD emerges with the leading score in the PCMark 10 Storage Bench, though it is followed quite closely by the SK hynix P31 in the Silverstone MS12 enclosure.


17 Comments
View All Comments
shabby - Friday, August 27, 2021 - link
External gaming ssd? Lol ok there marketing department 🙄vlad42 - Friday, August 27, 2021 - link
Well isn't it obvious? Everyone knows you frag harder and faster with the l33t g4m3r RGB LEDs!ceomrman - Monday, August 30, 2021 - link
Yellow is obviously the fastest color in general, but the ability to tweak the shades really comes in handy for specific tasks. Try Crysis with green lighting on your SSD - you'll be impressed by the mellow, smooth rendering that results. The Civilization series isn't a max FPS beast, so the more AI-friendly glow of blue lighting is optimal for strategy players. Take care, though - if you set the blue lights to blink randomly, you may find the increased sneakiness and aggression of the computer opponents difficult to overcome. And of course you can't beat the zing of a nice orange-red glow while you work on a Power Point presentation for the boss.Spunjji - Friday, September 3, 2021 - link
I'm getting Hi-Fi cable review vibes from this.Operandi - Tuesday, August 31, 2021 - link
It actually looks fine but why does everyone feel the need to tack "gaming" onto everything. Its cheesy AF and makes everything look like cheap marketing grab even if the product is good. Are all gamers really that simple minded?It would be like if Porsche wasn't able to sell any Caymans or 911s because it wasn't called the "Fast driving 911" or "Cayman Goes Fast" cause nobody would know that they were fast cars otherwise.
Dantte - Thursday, September 9, 2021 - link
But can it run Crysis?thestryker - Friday, August 27, 2021 - link
Thanks for including the DIY with the P31 in there with the other two. It's interesting to see the performance characteristics and the fact that it doesn't have as high peak power draw, costs less and works just as well.MDD1963 - Tuesday, August 31, 2021 - link
Yes, that extra 2 Watts on average consumed over the 30 minute period after a CrystalDiskMark workout could add up when electric bill day arrives! :)Spunjji - Friday, September 3, 2021 - link
2 watts less heat being dissipated through a passive enclosure seems a lot more relevant than electricity bills in this context.DigitalFreak - Friday, August 27, 2021 - link
Ok, now bring on the USB 4.0 external NVMe enclosures!