Jasper Lake Fanless Showdown: ECS LIVA Z3 and ZOTAC ZBOX CI331 nano UCFF PCs Review
by Ganesh T S on July 8, 2022 8:30 AM EST- Posted in
- Systems
- ZOTAC
- Fanless
- ECS
- Passive Cooling
- UCFF
- Mini-PC
- Jasper Lake
System Performance: UL and BAPCo Benchmarks
Our 2022 test suite for Windows 11-based systems carries over some of the standard benchmarks we have been using over the last several years, including UL's PCMark and BAPCo's SYSmark. Starting this year, we are also including BAPCo's CrossMark multi-platform benchmarking tool.
PCMark 10
UL's PCMark 10 evaluates computing systems for various usage scenarios (generic / essential tasks such as web browsing and starting up applications, productivity tasks such as editing spreadsheets and documents, gaming, and digital content creation). We benchmarked select PCs with the PCMark 10 Extended profile and recorded the scores for various scenarios. These scores are heavily influenced by the CPU and GPU in the system, though the RAM and storage device also play a part. The power plan was set to Balanced for all the PCs while processing the PCMark 10 benchmark.
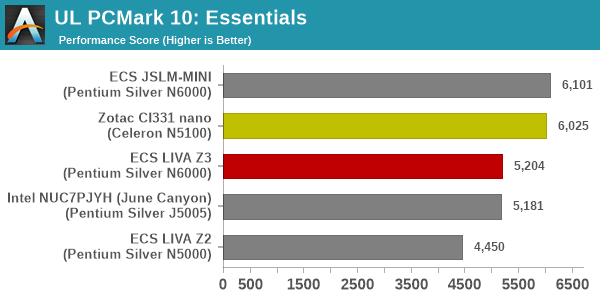
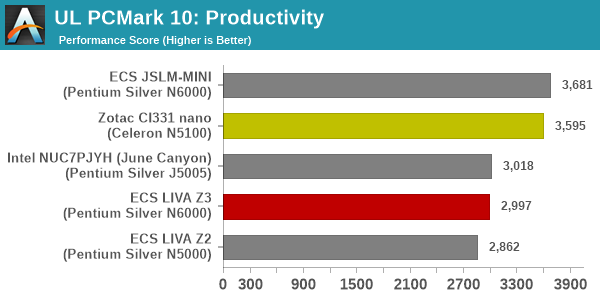
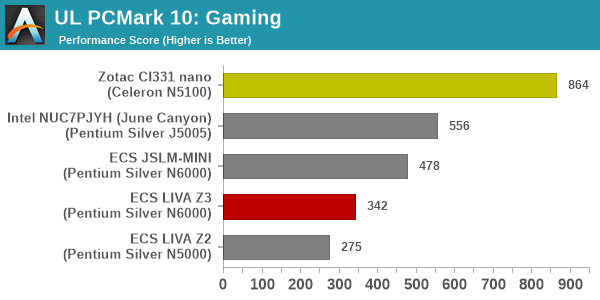
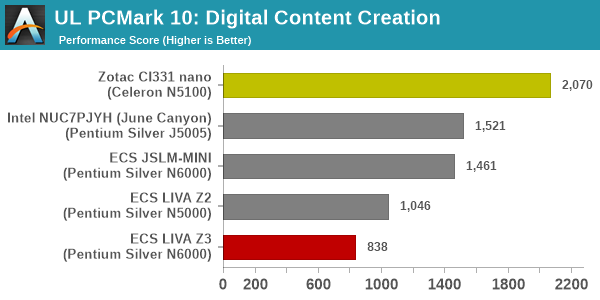
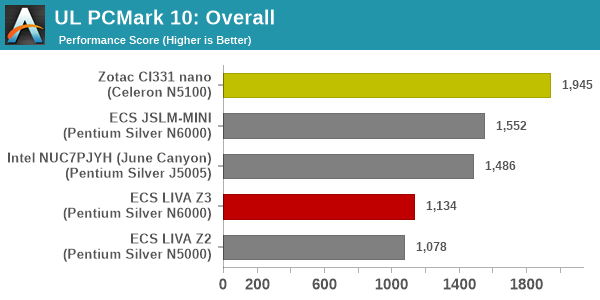
The first couple of workloads see the JSLM-MINI come out on top. With higher clock speeds compared to the CI331 nano, this is expected. However, gaming and digital content creation see the CI331 nano emerge ahead. This is despite the comparatively weaker GPU. As we shall see in a later section, this has probably got to do with the PL1 and PL2 limits set by ZOTAC for the product.
BAPCo SYSmark 25
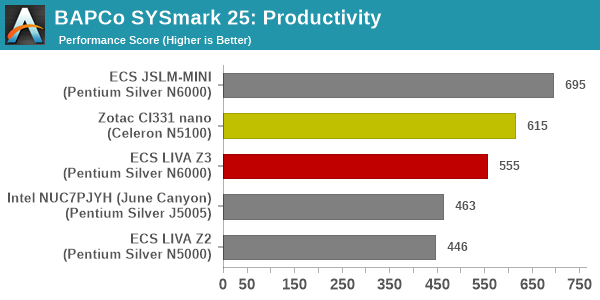
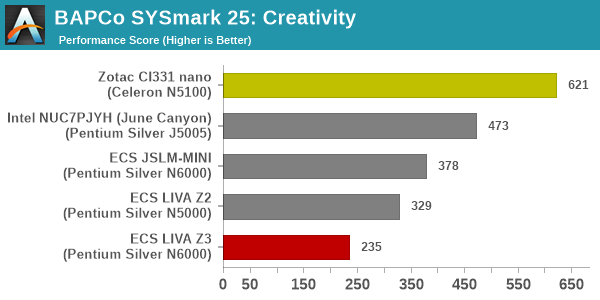
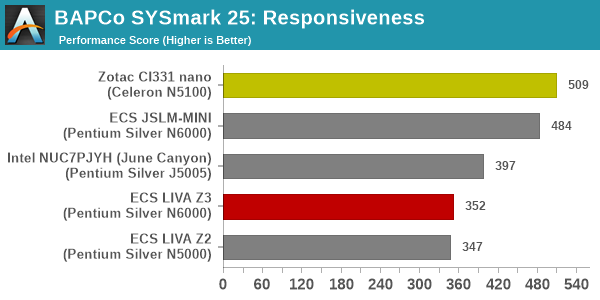
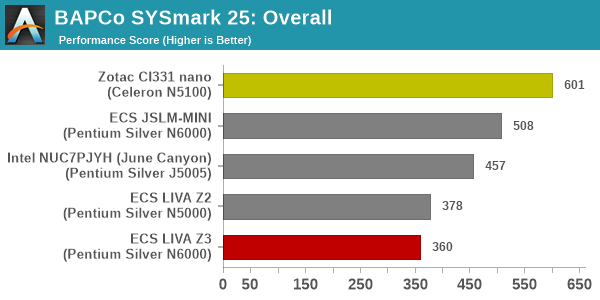
BAPCo's SYSmark 25 is an application-based benchmark that uses real-world applications to replay usage patterns of business users in the areas of productivity, creativity, and responsiveness. The 'Productivity Scenario' covers office-centric activities including word processing, spreadsheet usage, financial analysis, software development, application installation, file compression, and e-mail management. The 'Creativity Scenario' represents media-centric activities such as digital photo processing, AI and ML for face recognition in photos and videos for the purpose of content creation, etc. The 'Responsiveness Scenario' evaluates the ability of the system to react in a quick manner to user inputs in areas such as application and file launches, web browsing, and multi-tasking.
Scores are meant to be compared against a reference desktop (the SYSmark 25 calibration system, a Lenovo Thinkcenter M720q with a Core i5-8500T and 8GB of DDR4 memory to go with a 256GB M.2 NVMe SSD). The calibration system scores 1000 in each of the scenarios. A score of, say, 2000, would imply that the system under test is twice as fast as the reference system.
SYSmark 25 also adds energy measurement to the mix. A high score in the SYSmark benchmarks might be nice to have, but potential customers also need to determine the balance between power consumption and the performance of the system. For example, in the average office scenario, it might not be worth purchasing a noisy and power-hungry PC just because it ends up with a 2000 score in the SYSmark 25 benchmarks. In order to provide a balanced perspective, SYSmark 25 also allows vendors and decision makers to track the energy consumption during each workload. In the graphs below, we find the total energy consumed by the PC under test for a single iteration of each SYSmark 25 workload. For reference, the calibration system consumes 8.88 Wh for productivity, 10.81 Wh for creativity, and 19.69 Wh overall.
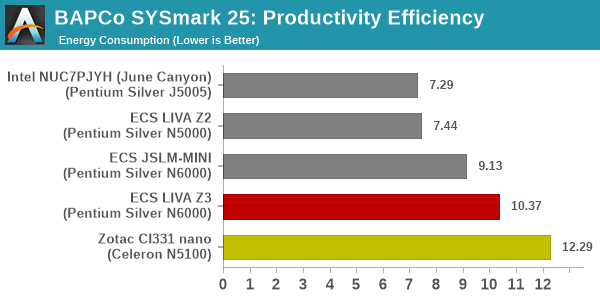
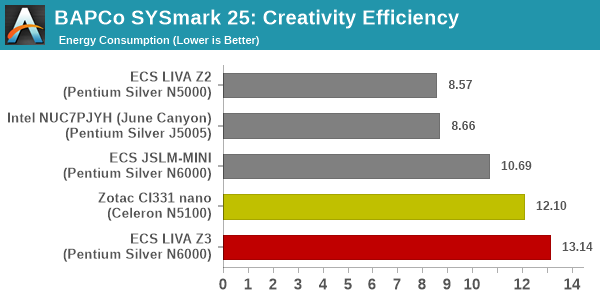
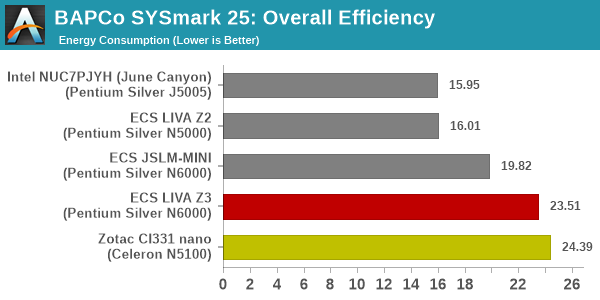
The observations made for the PCMark 10 workloads hold true here also. The JSLM-MINI's clock speeds help it come out on top for the productivity workloads. However, higher power limits help the CI331 nano wrest the lead overall. It is also not a surprise that the overall efficiency is the least for the CI331 nano - it consumes significantly more energy compared to the JSLM-MINI in order to get the honors in the performance score leaderboard.
BAPCo CrossMark 1.0.1.86
BAPCo's CrossMark aims to simplify benchmark processing while still delivering scores that roughly tally with SYSmark. The main advantage is the cross-platform nature of the tool - allowing it to be run on smartphones and tablets as well.
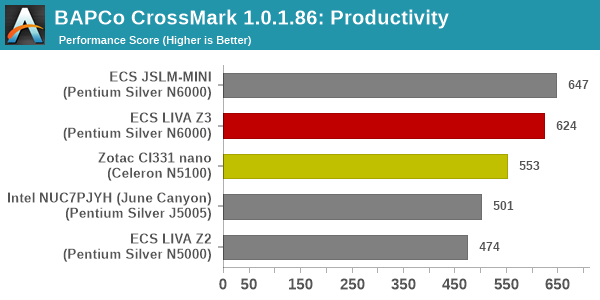
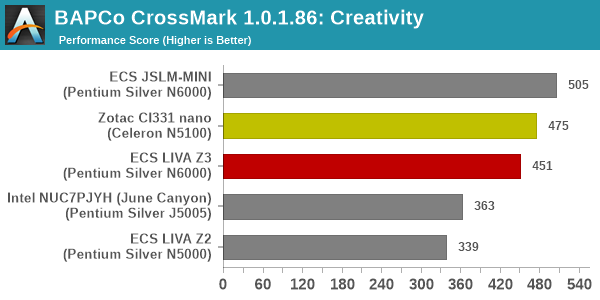
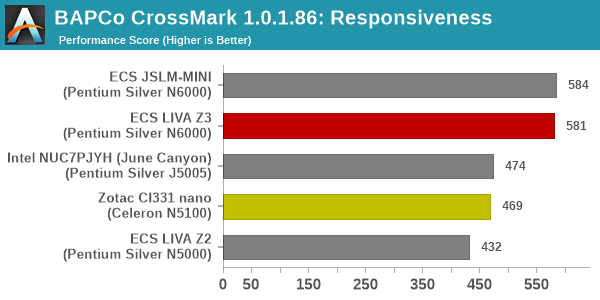
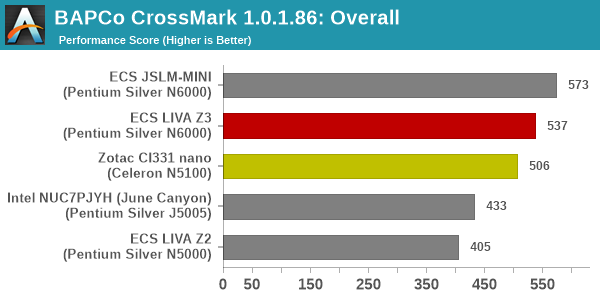
CrossMark is a relatively short-running benchmark (approx. 20 minutes) compared to SYSmark 25 (minimum of 4 hours). Here, the thermal throttling of the Z3 doesn't come into play, and the higher clock speeds in the JSLM-MINI can be sustained right through. The nett result is that this delivers results as one might expect based on the paper specifications - the JSLM-MINI on top with its high clock speeds and a thermal solution that works effectively. The Z3 is next, as long as it doesn't thermally throttle to such as extent that it falls behind the performance of the Celeron N5100 in the CI331 nano.


52 Comments
View All Comments
xol - Friday, July 8, 2022 - link
Correction (?)Neither of these reviewed products has a Intel UHD Graphics 605 .. (that's a 14nm Gemini part with 18 EU eg here https://ark.intel.com/content/www/us/en/ark/produc...
.. Intel seems to have not publisher a 'number' for this iGPU and seems to distinguish them by number of EU eg Jasper Lake 24EU eg https://www.intel.co.uk/content/www/uk/en/products...
xol - Friday, July 8, 2022 - link
Somehow messed up the link :UHD 605 https://ark.intel.com/content/www/us/en/ark/produc...
mode_13h - Friday, July 8, 2022 - link
Thanks for your coverage of fanless mini-PCs. However, I really wish you'd include something with "big cores", so we can get a sense of the scale of performance difference between them and Tremont.Another nice-to-have would be at least a few benchmarks including a Raspberry Pi 4. However, it has serious thermal throttling issues, unless it's actively cooled or you use a substantial passive cooling solution.
mode_13h - Friday, July 8, 2022 - link
I guess the ideal comparison would be a Tiger Lake-based system, since that's the same vintage and similar manufacturing tech as Tremont. Probably much harder to find in a fanless mini-PC, unless we're talking about an industrial PC, but I'd love even to see a comparison between two NUCs: Tiger Lake vs. Tremont.mode_13h - Friday, July 8, 2022 - link
Or maybe Ice Lake would be even better, but did they make Ice Lake-based NUCs?abufrejoval - Thursday, July 14, 2022 - link
Yes, Tiger Lake NUCs were made, but also very hard to come by: I have both.In a way they are perfect to showcase the benefit of E/P cores …in the case of Intel: AMD is really another story.
The two NUCs look nearly identical on the outside, but inside they are very different beasts.
For starters: The Tiger Lake NUC11 (i7-1165G7 with 96EU Xe iGPU) is configured with a 64 Watt PL2, a rather long TAU and even the PL2 is 30 Watts by default, I believe. There is a reason it comes with a 90 Watts power brick! I changed PL2 to 50, TAU to 10 seconds and PL1 to 15 Watts to ensure the fan would never howl they way it does with the defaults.
I’ve seen HWinfo report a 5GHz maximum clock, but 4.7GHz is the official top speed. It’s at 64 Watts and near 5GHz clocks that I have measured 1707/5808 Geekbench 4 results on Linux (always a bit faster than on Windows). Jasper Lake doesn’t quite play in the same league at 781/2540 using 3.3 GHz and 10 Watts. In Watts/compute power Tiger Lake looks rather worse than Jasper Lake, but when it comes to rendering a complex web page or recalculating a giant Excel sheet, its sprinting power certainly has it appear much faster.
At 64 Watts the Tiger Lake is a desktop CPU, shoehorned into mobile power envelopes. And when it’s constrained to the levels that passive cooling can manage (see the Supermicro SYS-E100-12T-H review here), it really struggles to deliver that performance. The great thing about the Tiger Lake NUC is that you can change PL1, PL2 and TAU to pretty much anything you want and when you set it to the 10 Watts the Jasper Lake gets to use as an absolute maximum, it starts to do rather badly.
Some of that is because the iGPU always gets preference, leaving close to nothing to the CPU. But some of that is that the remaining power budget forces very low frequencies, where the big Core CPU loses against the Atom cores running at a full speed with these Watts.
Jasper Lake, like all the other Atoms since the J1900, never slows down. I’ve never seen it drop below its “Turbo” clock unless idle, even on a mix of Prime95 and Furmark, and I’ve never seen it exceed 10 Watts of combined CPU+GPU power consumption either.
I also have two Ryzen 5800U based notebooks (1443/7855 on Geekbench4), one of which can be switched between 15 and 28 Watts of TDP. When Tiger Lake and Zen 3 are strictly set to the same power levels, Tiger Lake has to run much slower even with half the cores: Ryzen beats it with a much smaller energy footprint per core. But with Tiger Lake left at the default NUC settings (which a battery powered notebook could not support), its four cores will beat an eight core Zen 3 at 15 Watts in Geekbench, which luckily never seems to exceed TAU.
Intel needs E/P because P cores need too much power at the clock rates they require to beat a Ryzen core, and only with E cores they can hit the efficiency of Zen cores in fully multi-threaded loads.
mode_13h - Thursday, July 14, 2022 - link
Wow, another awesome post! Thanks for taking the time to relate your findings. Very interesting!> the iGPU always gets preference, leaving close to nothing to the CPU.
Very key point, but also one that Intel could conceivably address, to some extent, in future BIOS updates. Not that they're likely to, if it had been on the market for a while when you tested, but it's conceivable.
> in Geekbench, which luckily never seems to exceed TAU.
Another great point! I have never run Geekbench myself, and I haven't noticed reviewers mention this key detail.
Foeketijn - Saturday, September 3, 2022 - link
Don't you want to write for Anand?stanleyipkiss - Friday, July 8, 2022 - link
Zotac makes a fanless zbox with a 1165G7xol - Friday, July 8, 2022 - link
Benches I've seen suggest both are very similar in multi to a i3 low power Skylake eg a ie-6100T (2core 4 thread very common thin client chip) - the gfx capability also seems also a close match for the 24EU part [probably a very similar part with improved HEVC support] (the 32EU N6000 should be better)For single threaded the old Skylake is ~+50% faster., and from Skylake to Alder Lake it's nearly 2x , so nearly 3x from N5100 to i5-12500 for single thread
I have an old fanless Atom Z3735F (22nm) and these new SoCs are a impressive step up (~7x both cpu and gpu) -- I think the Pi Model B latest is very roughly 2x better than that nut no where near the 5100T in any metric.
tldr both benches would have been a wash one way of the other.