AMD 3rd Gen EPYC Milan Review: A Peak vs Per Core Performance Balance
by Dr. Ian Cutress & Andrei Frumusanu on March 15, 2021 11:00 AM ESTDisclaimer June 25th: The benchmark figures in this review have been superseded by our second follow-up Milan review article, where we observe improved performance figures on a production platform compared to AMD’s reference system in this piece.
SPECjbb MultiJVM - Java Performance
Moving on from SPECCPU, we shift over to SPECjbb2015. SPECjbb is a from ground-up developed benchmark that aims to cover both Java performance and server-like workloads, from the SPEC website:
“The SPECjbb2015 benchmark is based on the usage model of a worldwide supermarket company with an IT infrastructure that handles a mix of point-of-sale requests, online purchases, and data-mining operations. It exercises Java 7 and higher features, using the latest data formats (XML), communication using compression, and secure messaging.
Performance metrics are provided for both pure throughput and critical throughput under service-level agreements (SLAs), with response times ranging from 10 to 100 milliseconds.”
The important thing to note here is that the workload is of a transactional nature that mostly works on the data-plane, between different Java virtual machines, and thus threads.
We’re using the MultiJVM test method where as all the benchmark components, meaning controller, server and client virtual machines are running on the same physical machine.
The JVM runtime we’re using is OpenJDK 15 on both x86 and Arm platforms, although not exactly the same sub-version, but closest we could get:
EPYC & Xeon systems:
openjdk 15 2020-09-15

OpenJDK Runtime Environment (build 15+36-Ubuntu-1)

OpenJDK 64-Bit Server VM (build 15+36-Ubuntu-1, mixed mode, sharing)
Altra system:
openjdk 15.0.1 2020-10-20

OpenJDK Runtime Environment 20.9 (build 15.0.1+9)

OpenJDK 64-Bit Server VM 20.9 (build 15.0.1+9, mixed mode, sharing)
Furthermore, we’re configuring SPECjbb’s runtime settings with the following configurables:
SPEC_OPTS_C="-Dspecjbb.group.count=$GROUP_COUNT -Dspecjbb.txi.pergroup.count=$TI_JVM_COUNT -Dspecjbb.forkjoin.workers=N -Dspecjbb.forkjoin.workers.Tier1=N -Dspecjbb.forkjoin.workers.Tier2=1 -Dspecjbb.forkjoin.workers.Tier3=16"
Where N=160 for 2S Altra test runs, N=80 for 1S Altra test runs, N=112 for 2S Xeon, N=56 for 1S Xeon, and N=128 for 2S and 1S on the EPYC system. The 75F3 system had the worker count reduced to 64 and 32 for 2S/1S runs.
In terms of JVM options, we’re limiting ourselves to bare-bone options to keep things simple and straightforward:
EPYC & Altra systems:
JAVA_OPTS_C="-server -Xms2g -Xmx2g -Xmn1536m -XX:+UseParallelGC "

JAVA_OPTS_TI="-server -Xms2g -Xmx2g -Xmn1536m -XX:+UseParallelGC"

JAVA_OPTS_BE="-server -Xms48g -Xmx48g -Xmn42g -XX:+UseParallelGC -XX:+AlwaysPreTouch"
Xeon system:
JAVA_OPTS_C="-server -Xms2g -Xmx2g -Xmn1536m -XX:+UseParallelGC"

JAVA_OPTS_TI="-server -Xms2g -Xmx2g -Xmn1536m -XX:+UseParallelGC"

JAVA_OPTS_BE="-server -Xms172g -Xmx172g -Xmn156g -XX:+UseParallelGC -XX:+AlwaysPreTouch"
The reason the Xeon system is running a larger back-end heap is because we’re running a single NUMA node per socket, while for the Altra and EPYC we’re running four NUMA nodes per socket for maximised throughput, meaning for the 2S figures we have 8 backends running for the Altra and EPYC and 2 for the Xeon, and naturally half of those numbers for the 1S benchmarks. The back-ends and transaction injectors are affinitised to their local NUMA node with numactl –cpunodebind and –membind, while the controller is called with –interleave=all.
The max-jOPS and critical-jOPS result figures are defined as follows:
"The max-jOPS is the last successful injection rate before the first failing injection rate where the reattempt also fails. For example, if during the RT-curve phase the injection rate of 80000 passes, but the next injection rate of 90000 fails on two successive attempts, then the max-jOPS would be 80000."
"The overall critical-jOPS is computed by taking the geomean of the individual critical-jOPS computed at these five SLA points, namely:
• Critical-jOPSoverall = Geo-mean of (critical-jOPS@ 10ms, 25ms, 50ms, 75ms and 100ms response time SLAs)
During the RT curve building phase the Transaction Injector measures the 99th percentile response times at each step level for all the requests (see section 9) that are considered in the metrics computations. It then computes the Critical-jOPS for each of the above five SLA points using the following formula:
(first * nOver + last * nUnder) / (nOver + nUnder) "
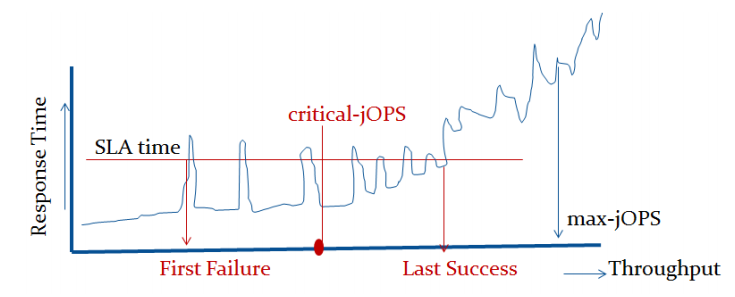
That’s a lot of technicalities to explain an admittedly complex benchmark, but the gist of it is that max-jOPS represents the maximum transaction throughput of a system until further requests fail, and critical-jOPS is an aggregate geomean transaction throughput within several levels of guaranteed response times, essentially different levels of quality of service.
Beyond the result figures, the benchmark keeps detailed track of timings of responses and tracks a few important statistical data-points across a response-time curve, as follows:

2S EPYC 7763 THP Enabled
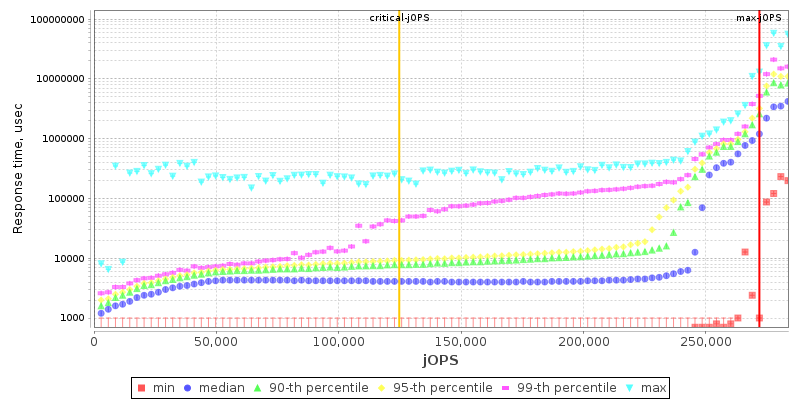
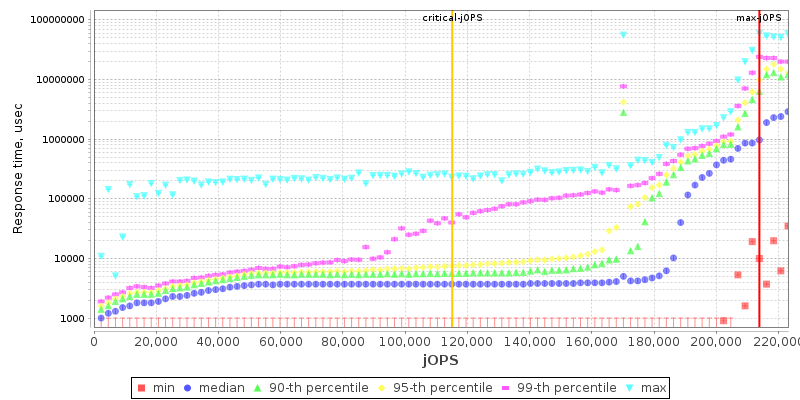
2S EPYC 7742 THP Enabled
In terms of the response curves of the new Milan 7763 part, the general behaviour doesn’t look that much different to the 7742 other than a weird discrepancy at low load.
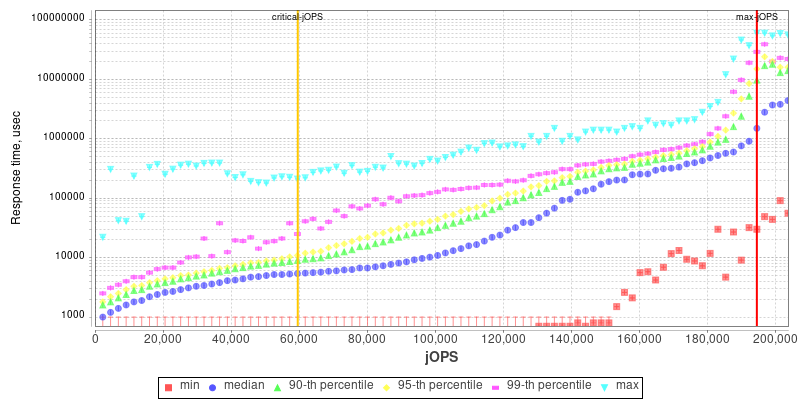
2S EPYC 75F3 THP Enabled
The 75F3 part is interesting as due to it focusing more on per-core performance, it tightens the response curve with the -critical performance score being closer to the -max capacity of the system.

2S Xeon 8280 THP Enabled
2S Altra Q80-33 THP Enabled
I included the Intel and Altra graphs for context.
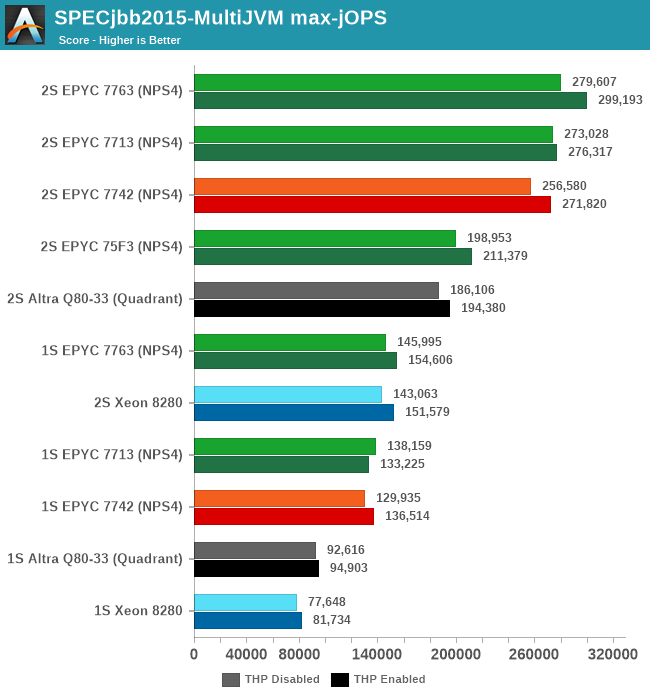
In terms of the -max-jOPS achieved by each system in our settings configuration, the new Zen3 parts fare quite well. The 7763 outperforms the 7742 by +9%, while the 7713 also outperforms the 7742 by +6.4%.
Again, very interesting is to see the 75F3’s maximum throughput reaching 71% of the top SKU’s performance in such scale-out workloads even though it’s only got half the cores available.
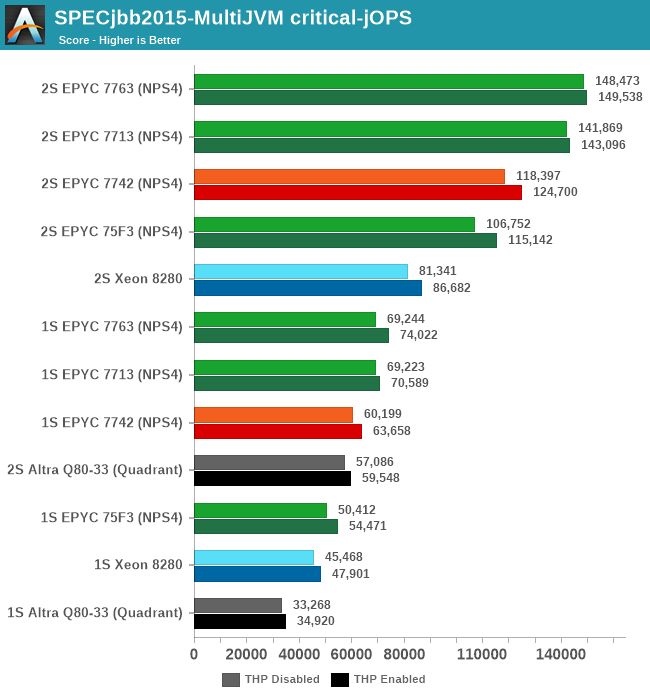
The -critical-jOPS figure is probably the more important metric for SPECjbb given that it covers SLA scenarios, and here the new Milan parts are faring extremely well. The 7763 outperforms the 7742 by +25%, and the 7713 is also not far behind with +19.7%.
The 75F3 is also doing amazingly well, keeping up with the higher core-count parts.
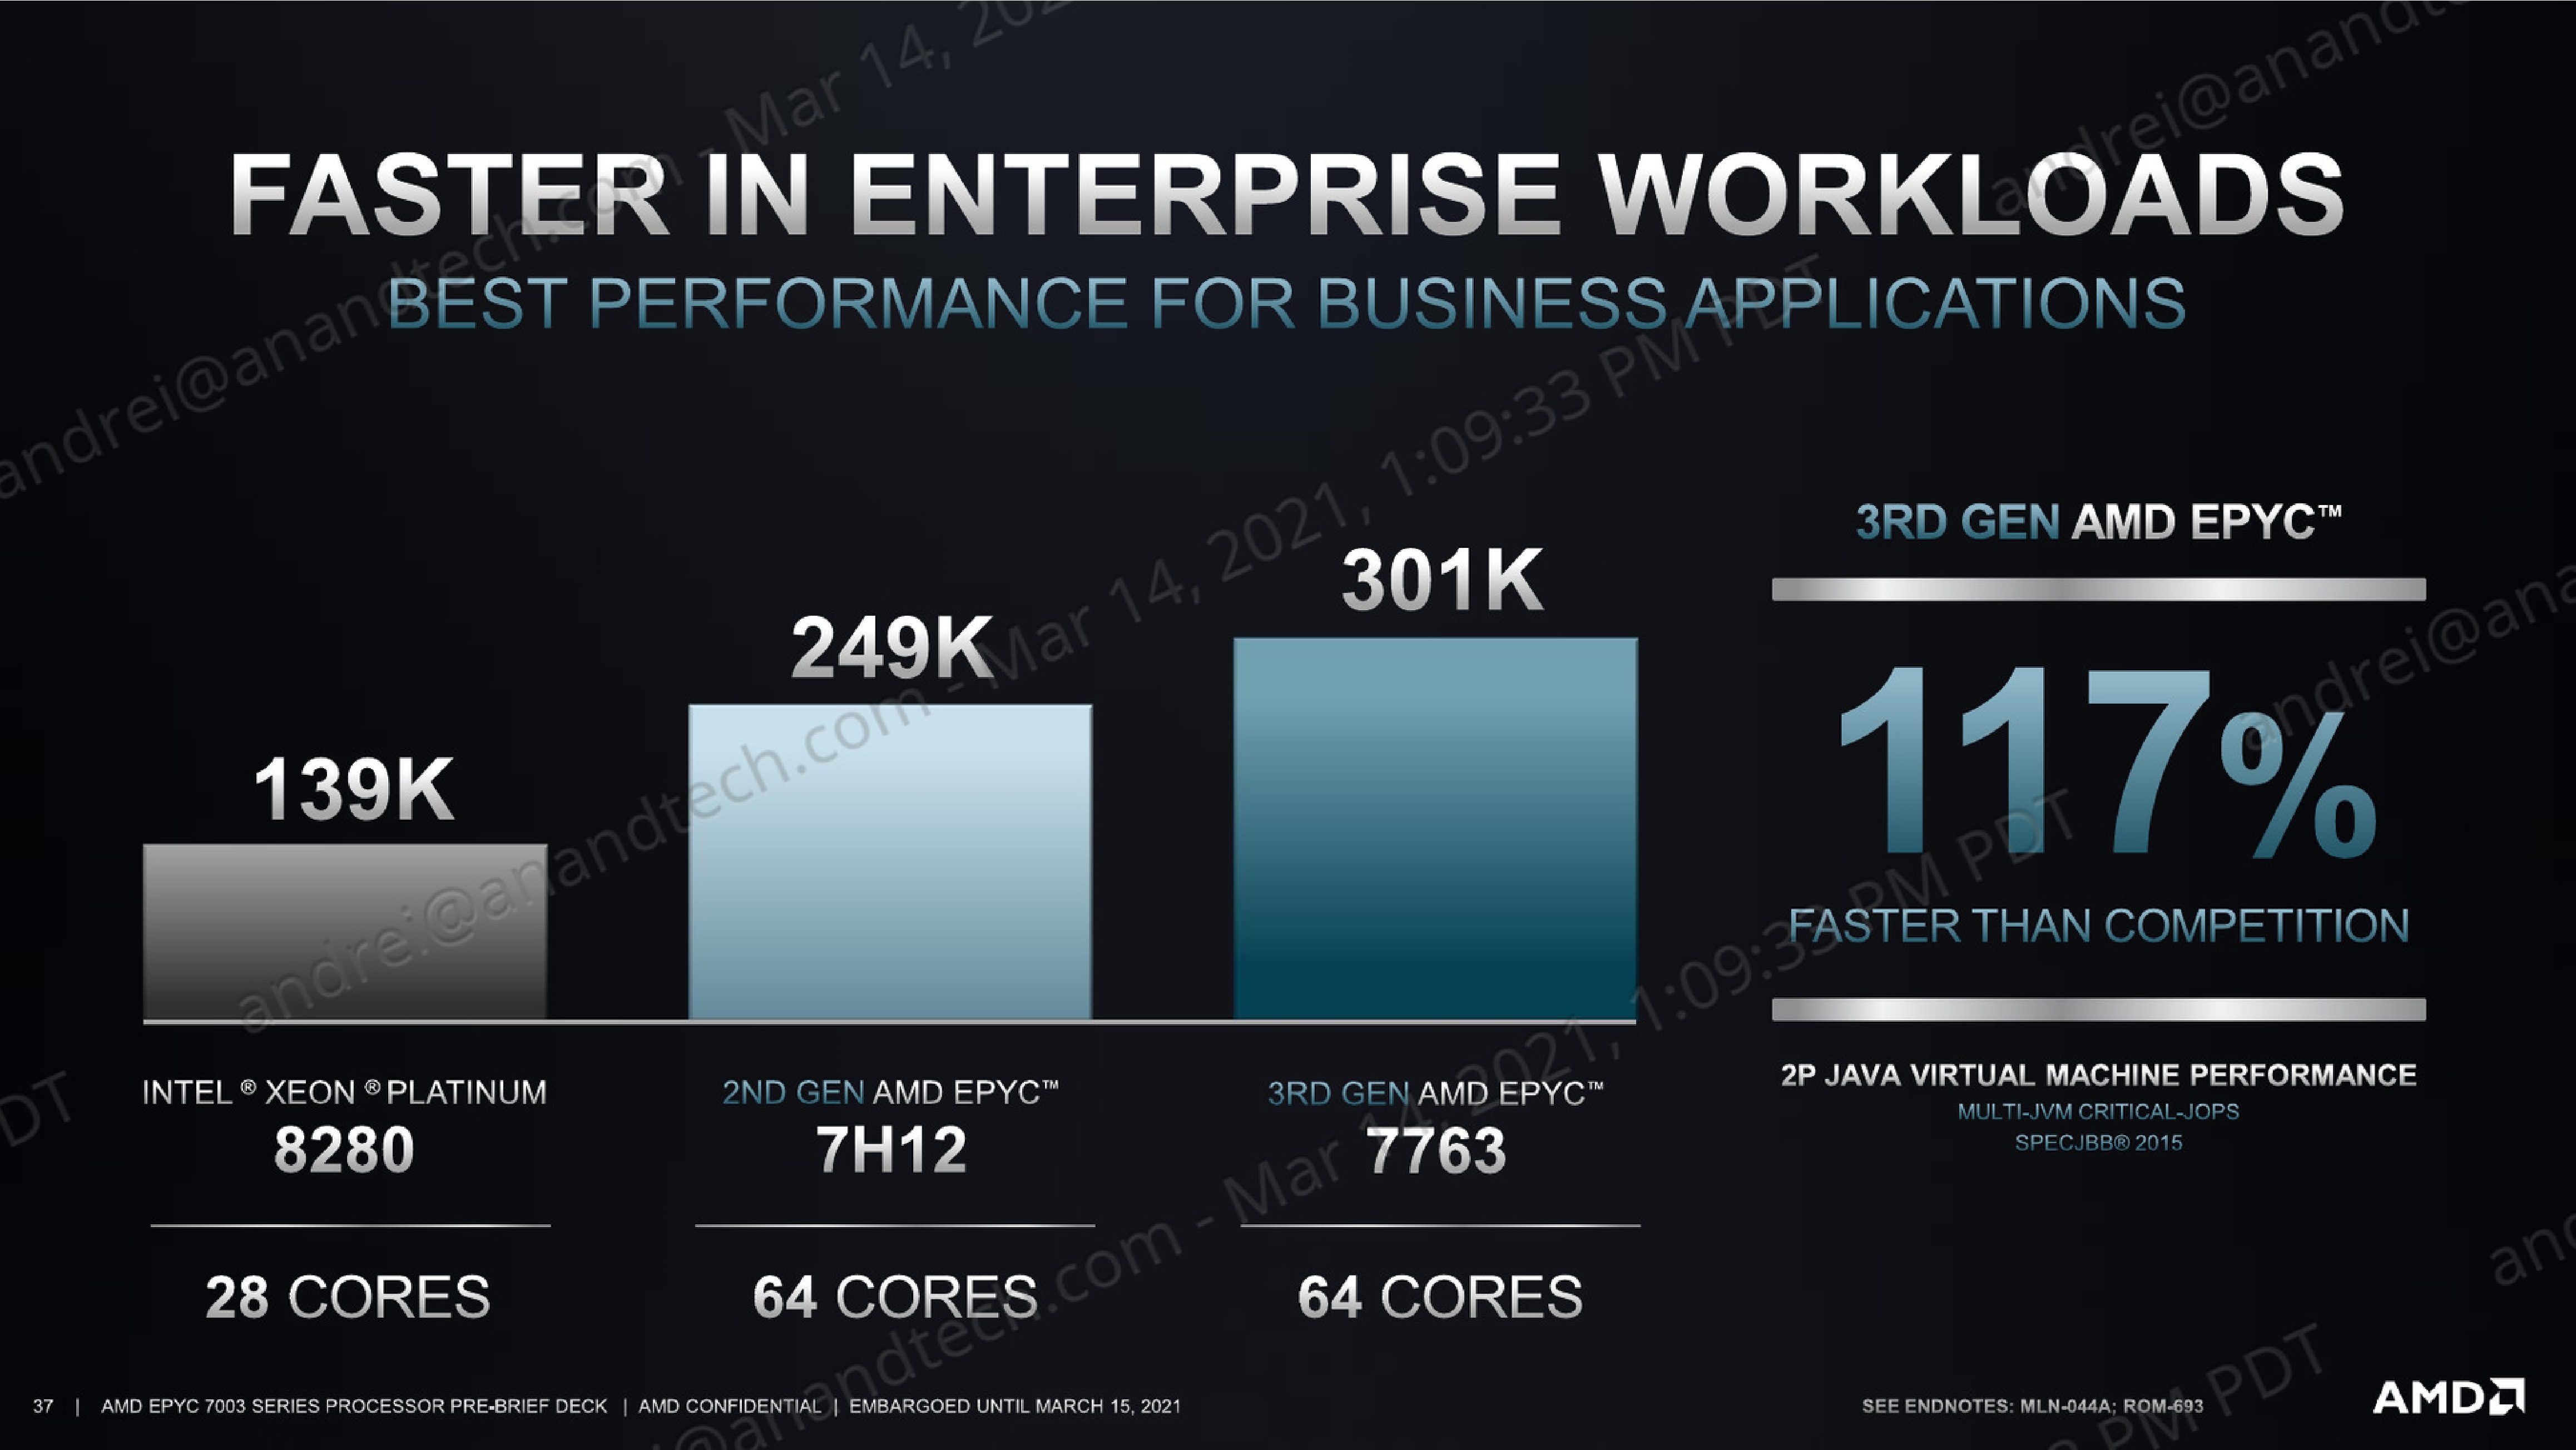
Against the competition, our own and AMD figures differ a bit due to different settings, however we’re still seeing the new Milan top-SKU outperform the 8280 by +82 in performance.
Generally speaking, the generational improvements over Rome in -critical-jOPS figure of SPECjbb are a more reassuring result compared to the other peak full load performance metrics we’ve seen on SPEC CPU. This actually corresponds to the power behaviour of the new chips, with the new Zen3 cores offering notably better per-core performance compared to the Rome predecessor, at least up until the new parts hit a power envelope wall where performance improvements become more limited.


120 Comments
View All Comments
mode_13h - Monday, March 15, 2021 - link
Please don't paint Nvidia as a victim. They are not. All of these guys will have to support each other, for the foreseeable future, and for purely pragmatic reasons.Oxford Guy - Monday, March 15, 2021 - link
They are not 'guys'. They're corporations. Corporations were invented to, to quote Ambrose Bierce, grant 'individual profit without individual responsibility'.mode_13h - Wednesday, March 17, 2021 - link
No disagreement, but I'm slightly disheartened you decided to take issue with my use of the term "guys". I'll try harder, next time--just for you.Oxford Guy - Tuesday, April 6, 2021 - link
People humanize corporations all the time. It doesn't lead to good outcomes for societies.Of course, it's questionable whether corporations lead to good outcomes, considering that they're founded on scamming people (profit being 'sell less for more', needing tricks to get people to agree to that).
chavv - Monday, March 15, 2021 - link
Is it possible to add another "benchmark" - ESX server workload?Like, running 8-16-32-64 VMs all with some workload...
Andrei Frumusanu - Monday, March 15, 2021 - link
As we're rebuilding our server test suite, I'll be looking into more diverse benchmarks to include. It's a long process that needs a lot of thought and possibly resources so it's not always evident to achieve.eva02langley - Monday, March 15, 2021 - link
Just buy EPYC and start your hybridation and your reliance on a SINGLE supplier...eva02langley - Monday, March 15, 2021 - link
edit: Just buy EPYC and start your hybridation and STOP your reliance on a SINGLE supplier...mode_13h - Monday, March 15, 2021 - link
You guys should really include some workloads involving multiple <= 16-core/32-thread VMs, that could highlight the performance advantages of NPS4 mode. Even if all you did was partition up the system into smaller VMs running multithreaded SPEC 2017 tests, at least that would be *something*.That said, please don't get rid of all system-wide multithreaded tests, because we definitely still want to see how well these systems scale (both single- and multi- CPU).
ishould - Monday, March 15, 2021 - link
Yes this seems more useful for my needs as well. We use a grid system for job submission and not all cores will be hammered at the same time