A Lighter Touch: Exploring CPU Power Scaling On Core i9-13900K and Ryzen 9 7950X
by Gavin Bonshor on January 6, 2023 8:00 AM EST- Posted in
- CPUs
- AMD
- Intel
- 65W
- TDP
- Ryzen 9 7950X
- Core i9-13900K
- Power Scaling
- Efficiency
- 105W
- 125W
- 253W
- 230W
- PPT
Core i9-13900K & Ryzen 9 7950X Scaling Performance: CPU Short Form
For the compute side of our testing to determine how well the Core i9-13900K and Ryzen 9 7950X scale at different power levels, we've opted for a range of CPU-intensive benchmarks, particularly from the rendering and encoding section of our test suite.
To keep the playing field even, we are using the same SK Hynix DDR5-5600B 2 x 16 GB memory kit throughout all of our testing. We've separated the results within the same graph to outlay performance differences at different power levels so that users can see the differences and comparison in performance on offer from both the Core i9-13900K and Ryzen 9 7950X processors.
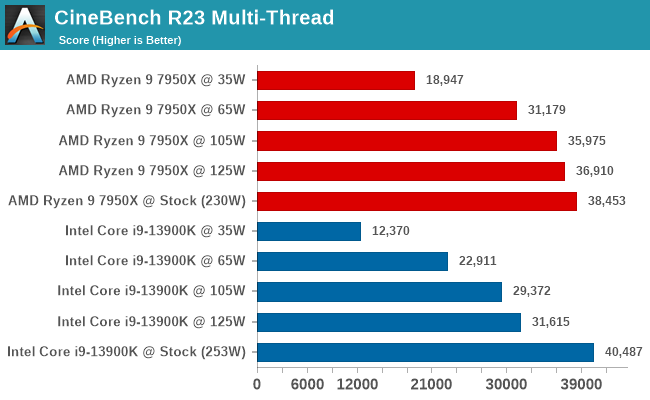
CineBench R23: Single and Multi-Threaded Performance
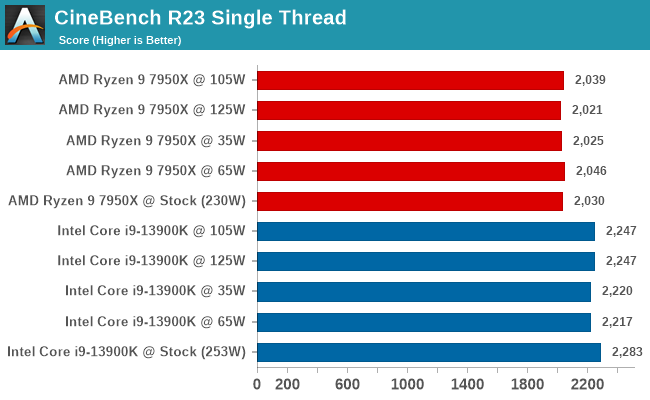
Focusing on performance in CineBench, it is worth highlighting that in the single-threaded test, Intel's Core i9-13900K displayed better single-core performance throughout. It didn't impact single-threaded performance on either processor despite restricting the power levels, which is exactly what we'd expect to find. While highly clocked CPU cores are very expensive from a power perspective, they are not so expensive as to consume the complete power budget of chips such as these.
Looking at multi-threaded performance in CineBench R23, this is where restricting the power levels makes the difference. Although Intel has the best performance in CineBench R23 MT at stock settings, it's AMD that scales better (i.e. loses less performance) as the power is restricted. Even at 65 W, the Ryzen 9 7950X is faster than the Core i9-13900 at 125 W, which is very impressive. Both processors take a massive hit in performance at 35 W, which is to be expected as we're now some 200 Watts below their stock power limits.
C-Ray 1.2: 4K, 16 Rays Per Pixel
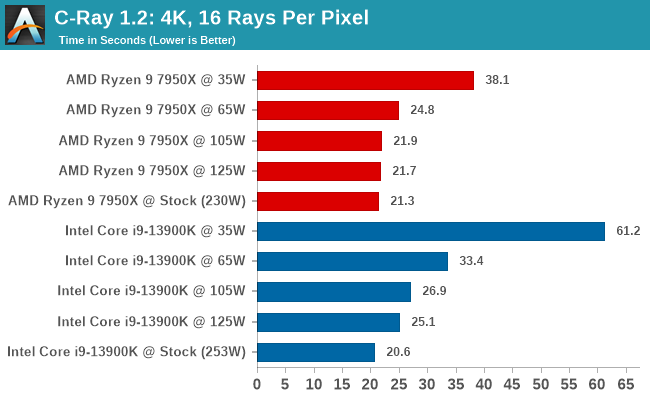
Looking at the results in our C-Ray benchmark, the results between stock settings to 65 W impacted our figures. Starting with the Ryzen 9 7950X, there was a marginal performance loss between stock settings at 125 W and 105 W. Going from stock settings to 65 W (2.5X power), there was a drop in C-Ray performance of around 16%.
Focusing on the Core i9-13900K, its performance was heavily power reliant when comparing stock settings to 125 W, 105 W, and 65 W. Even from stock settings to 125 W, there's a performance loss of around 21%, and even more so comparing stock settings to 65 W, which equates to around 38%.
Things tailed off massively when both set to 35 W, with the AMD Ryzen 9 7950X beating the Intel Core i9-13900K convincingly here.
POV-Ray 3.7.1:
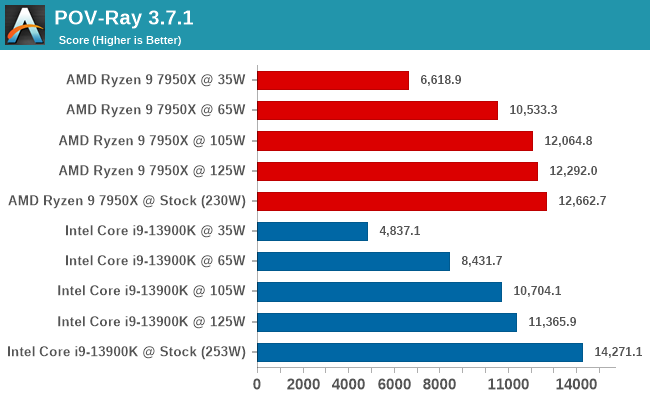
In our POV-Ray benchmark, we saw some interesting behavior. Although the Core i9-13900K at default settings comfortably beat the Ryzen 9 7950X, the 7950X held its performance well when dropping down the power, with the 7950X's result at 65 W being similar to the 13900K at 105 W. This shows that the Ryzen 9 7950X and its 5 nm die is more scalable at lower power.
Blender 3.4: CPU Only Compute
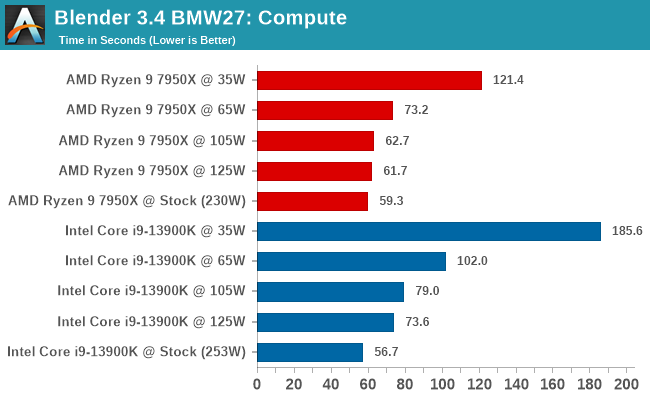
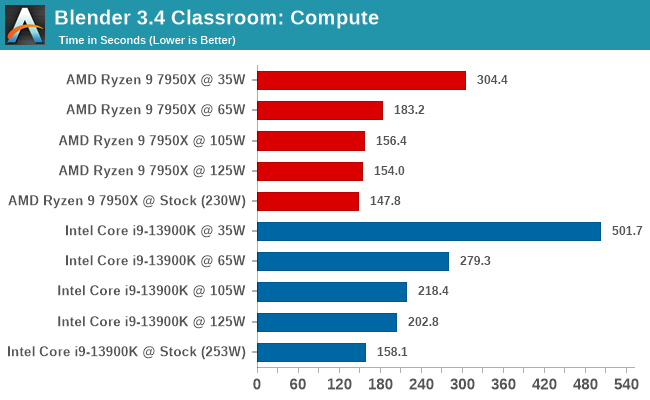
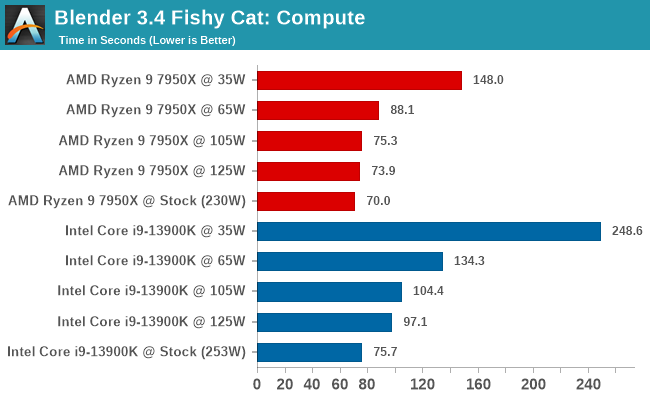
At default settings, the Core i9-13900K and Ryzen 9 7950X was competitive in all of the Blender sub-tests, even when restricting the power. Once power was restricted, we saw that the 7950X held onto much of its performance, while the 13900K didn't fare so well. In the Fishy Cat subtest at 65 W, the 7950X was 62% faster than the 13900K, which is impressive scaling here by AMD.
x264 Encoding: 1080p and 4K Bosphorus
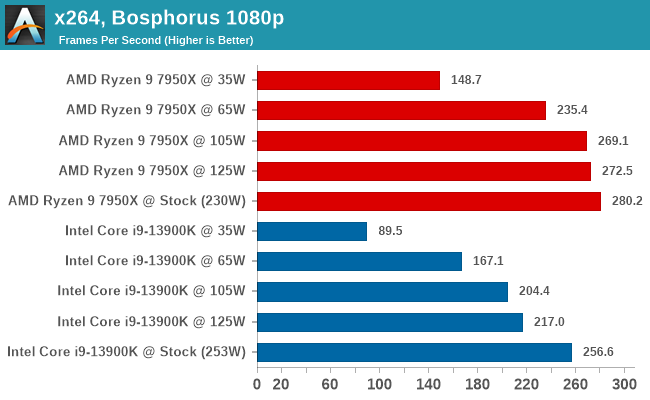
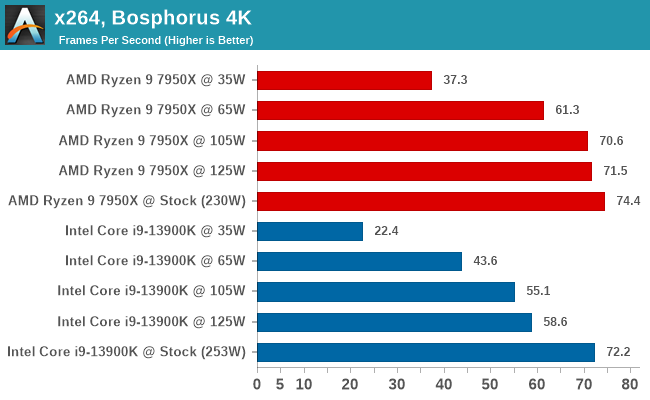
The x264 benchmark focuses on encoding performance, and at default settings, AMD's Ryzen 9 7950X wins out. Even dropping down to 125 W, the 7950X only loses around 2% at 1080p and around 4% at 105 W. At 65 W, the 7950X is around 16% slower than at default settings.
Looking at Intel's Core i9-13900K, the 13900K loses around 15% performance by restricting power to 125 W compared to default settings. This is another example that the 5 nm Zen 4 architecture scales much better at lower power envelopes than Intel's 10 nm refresh; this isn't unexpected, however.


61 Comments
View All Comments
ABR - Thursday, January 12, 2023 - link
Still, they could make the high-power mode opt-in rather than the other way around. Like the old turbo buttons.hMunster - Friday, January 6, 2023 - link
You say that Intel loses more performance when scaling down - but on the other hand Intel also seems to adhere to lower limits more than AMD, so what's really going on?If the Intel at 65W setting consumes much less than the AMD at the same 65W setting then the whole comparison needs to be changed to use actual power draw, not the configured one!
Redbbull - Friday, January 6, 2023 - link
On our Cinebench R15 test, which includes both single-core and multi-core workflows, the Ryzen 9 far outpaces the Core i9 when it's using all of its cores and threads.Josh128 - Friday, January 6, 2023 - link
Why in the world are you using blue for the AMD graphs and orange for the Intel? Also, this test would be so much better if you used CPU socket power draw (PPT for AMD, not sure of the Intel equivalent) to make the measurements.Gavin Bonshor - Friday, January 6, 2023 - link
I did use PPT for AMD, but why they are going above that threshold is something I need to test on more boards, which I need some time for.And the color of the graphs wasn't a concern to me, but if it appeases you/others, I'm more than happy to change them over when I've spent some much-needed time with my children (I'm already working over the weekend as it is).
cyrusfox - Friday, January 6, 2023 - link
We call can wait for that, family first. Thank you so much for this. Pretty shocking to me, AMD appears to win at all power match settings. My only concern is AMD is actually using more power then advertised, so understanding that or putting in a correction ratio to understand true watt to watt comparison would help Intel but looks like they are still going to come up short.Thank you much for this original content!
Farfolomew - Friday, January 6, 2023 - link
Not that history always repeats itself, but this current GhZ war and TDP ramping-up is reminiscent of the circa ~2005 with Pentium 4 Prescott and then Pentium Dual Core as well. The only way Intel back then were able to compete and beat Athlon 64 was on the GhZ path.Perhaps Meteor lake can bring the TDP back down to sensible levels with huge increases in IPC and efficiency gains much like the Core 2 Duo did?
In that case, what does AMD have planned to compete with that? They'll also need to significantly raise their IPC while dropping clocks to compete
Gavin Bonshor - Friday, January 6, 2023 - link
Both Intel and AMD announced 65 W SKUs due out this month, so it'll be interesting to see how that pans out performance-per-watt wiseWereweeb - Saturday, January 7, 2023 - link
Not Meteor Lake, no. We'll need GAAFETs and backside power delivery to substantially increase efficiency.But even then, I don't think the high TDP's are going anywhere. It's the cheapest and easiest way for brands to increase their performance metrics, and today every other way is extremely expensive.
Der Keyser - Friday, January 6, 2023 - link
Very interesting test and results indeed. But how much more can be had by adding undervolting into the mix? I know that moves the tests into the silicon lottery territory, but still?The tests performed all depends on - presumably - the BIOS code and voltage levels of the vendor. That may or may not be 100% according to Intel/AMDs specs. It could be really interesting to see what additonal gains could be found by undervolting across fx. Three different samples of the same CPU.